
Form 8-K Rockwood Holdings, Inc. For: Nov 05
�
�
UNITED STATES
SECURITIES AND EXCHANGE COMMISSION
WASHINGTON, DC 20549
�
�
FORM�8-K
�
CURRENT REPORT
�
�
PURSUANT TO SECTION�13 OR 15(d)�OF THE SECURITIES EXCHANGE ACT OF 1934
Date of Report (Date of earliest event reported): November�5, 2014
�
Rockwood Holdings,�Inc.
(Exact name of registrant as specified in its charter)
�
|
Delaware |
� |
001-32609 |
� |
52-2277366 |
|
(Jurisdiction of Incorporation) |
� |
(Commission File Number) |
� |
(IRS Employer |
�
100 Overlook Center
Princeton, New Jersey 08540
(Address of registrant�s principal executive office)
�
(609) 514-0300
(Registrant�s telephone number)
�
Check the appropriate box below if the Form�8-K filing is intended to simultaneously satisfy the filing obligation of the registrant under any of the following provisions:
�
o��������������������� Written communications pursuant to Rule�425 under the Securities Act
�
o��������������������� Soliciting material pursuant to Rule�14a-12 under the Exchange Act
�
o��������������������� Pre-commencement communications pursuant to Rule�14d-2(b)�under the Exchange Act
�
o��������������������� Pre-commencement communications pursuant to Rule�13e-4(c)�under the Exchange Act
�
�
�
�
Item 2.02.��������������������������������������� Results of Operations and Financial Condition.
�
On November�5, 2014, Rockwood Holdings,�Inc. (the �Company�) issued a press release discussing the Company�s results of operations for the third quarter ended September�30, 2014. A copy of the press release is attached to this Current Report on Form�8-K as Exhibit�99.1. The Company will also host a conference call and webcast on November�5, 2014 to discuss its third quarter results of operations. A copy of the conference call presentation materials is attached to this Current Report on Form�8-K as Exhibit�99.2.
�
The information disclosed in this Current Report on Form�8-K and the Exhibits shall not be deemed �filed� for the purpose of Section�18 of the Securities Exchange Act of 1934, as amended (the �Exchange Act�), or otherwise subject to the liabilities of that section, nor shall it be deemed incorporated by reference in any filing under the Securities Act of 1933, as amended, or the Exchange Act, except as shall be expressly set forth by specific reference in such a filing.
�
Item 9.01.��������������������������������������� Financial Statements and Exhibits.
�
(d)�������������������������������� Exhibits.
�
|
Exhibit�No. |
� |
Description |
|
� |
� |
� |
|
99.1 |
� |
Press Release dated November�5, 2014. |
|
� |
� |
� |
|
99.2 |
� |
November�5, 2014 Conference Call Presentation Materials. |
�
�
SIGNATURES
�
Pursuant to the requirements of the Securities Exchange Act of 1934, the Registrant has duly caused this report to be signed on its behalf by the undersigned hereunto duly authorized.
�
�
|
ROCKWOOD HOLDINGS,�INC. |
� | |
|
� |
� | |
|
� |
� |
� |
|
By: |
/s/ Michael W. Valente |
� |
|
� |
Name: Michael W. Valente |
� |
|
� |
Title: ��Assistant Secretary |
� |
|
� |
� |
� |
|
� |
� |
� |
|
Dated: November�5, 2014 |
� | |
�
Exhibit�99.1
�

�
Rockwood Reports Third Quarter 2014 Results
�
Highlights
�
������������������ Strong quarterly results and margins driven by strong demand growth from nearly all surface treatment applications, lithium battery applications, potash and the Talison joint venture, offset partially by organometallics
������������������ Adjusted earnings per share from continuing operations - $0.63 per share versus $0.39 per share
������������������ Adjusted EBITDA from continuing operations - $101 million versus $82 million
������������������ Completed (October�1) the sale of our Titanium Dioxide Pigments and four other non-strategic businesses for net cash proceeds of approximately $950 million, subject to certain potential post-closing adjustments
������������������ Progressing on the announced (July�15) merger with Albemarle to create a premier global specialty chemicals company with four leading businesses
�
Princeton, New Jersey; November�5, 2014 � Rockwood Holdings,�Inc. (NYSE: ROC) today posted as reported net income from continuing operations of $54.4 million, or $0.75 per share for the third quarter of 2014, which included other net benefits of $9.1 million, as compared to $8.4 million, or $0.11 per share for the same period in the prior year, which included other net charges of $21.5 million.
�
Excluding these other net benefits and charges, adjusted net income from continuing operations was $45.3 million, or $0.63 per share, in the third quarter of 2014 compared to $29.9 million, or $0.39 per share, for the same period in the prior year. Quarter on quarter results benefited from strong performance in Surface Treatment and battery applications and potash in Lithium, which more than offset lower organometallics volumes.� Also driving strong quarter results was the contribution from the 49% interest in the Talison Lithium joint venture and lower interest expense. Earnings per share benefited from fewer common shares outstanding due to share repurchases.
�
For the nine months ended September�30, 2014, as reported net income from continuing operations was $110.2 million, or $1.50 per share, which included other net charges of $12.8 million, as compared to $40.6 million, or $0.52 per share for the same period in the prior year, which included other net charges of $42.7 million.
�
Excluding these other net charges, adjusted net income from continuing operations was $123.0 million, or $1.67 per share, in the nine months ended September�30, 2014 as compared to $83.3 million, or $1.06 per share, for the same period in the prior year. Year-on-year results also benefited from strong performance in Surface Treatment and battery applications in Lithium, the contribution from the 49% interest in the Talison
�
�
Lithium joint venture and lower interest expense, which more than offset lower organometallics volumes and a decrease in potash sales. Earnings per share benefited from fewer common shares outstanding due to share repurchases.
�
Table 1: Third Quarter and YTD Financial Highlights
�
Continuing Operations *
�
|
� |
� |
� |
� |
� |
� |
%�Change |
� |
� |
� |
� |
� |
%�Change |
� | ||||||||
|
� |
� |
� |
� |
� |
� |
� |
� |
Constant |
� |
� |
� |
� |
� |
� |
� |
Constant |
� | ||||
|
($�and�shares�in�millions;�except�per�share�amounts) |
� |
Q3�2014 |
� |
Q3�2013 |
� |
Total |
� |
Currency |
� |
YTD�2014 |
� |
YTD�2013 |
� |
Total |
� |
Currency |
� | ||||
|
Net sales |
� |
$ |
356.3 |
� |
$ |
345.8 |
� |
3.0 |
% |
3.5 |
% |
$ |
1,073.1 |
� |
$ |
1,030.8 |
� |
4.1 |
% |
3.9 |
% |
|
Adjusted EBITDA (a) |
� |
100.6 |
� |
81.6 |
� |
23.3 |
% |
23.4 |
% |
270.1 |
� |
245.1 |
� |
10.2 |
% |
9.6 |
% | ||||
|
Net income |
� |
54.4 |
� |
8.4 |
� |
547.6 |
% |
� |
� |
110.2 |
� |
40.6 |
� |
171.4 |
% |
� |
� | ||||
|
Diluted EPS |
� |
0.75 |
� |
0.11 |
� |
581.8 |
% |
� |
� |
1.50 |
� |
0.52 |
� |
188.5 |
% |
� |
� | ||||
|
Net income - as adjusted |
� |
45.3 |
� |
29.9 |
� |
51.5 |
% |
� |
� |
123.0 |
� |
83.3 |
� |
47.7 |
% |
� |
� | ||||
|
Diluted EPS - as adjusted |
� |
0.63 |
� |
0.39 |
� |
61.5 |
% |
� |
� |
1.67 |
� |
1.06 |
� |
57.5 |
% |
� |
� | ||||
|
Cash flow provided by operating activities |
� |
79.1 |
� |
72.9 |
� |
(8.5 |
)% |
� |
� |
141.5 |
� |
91.8 |
� |
54.1 |
% |
� |
� | ||||
|
Capital expenditures |
� |
45.8 |
� |
45.8 |
� |
0.0 |
% |
� |
� |
134.4 |
� |
128.7 |
� |
4.4 |
% |
� |
� | ||||
|
Weighted average number of diluted shares outstanding |
� |
72.2 |
� |
75.9 |
� |
(4.9 |
)% |
� |
� |
73.5 |
� |
78.3 |
� |
(6.1 |
)% |
� |
� | ||||
�
* The Advanced Ceramics business, Clay-based Additives business, and the Titanium Dioxide Pigments, Color Pigments and Services, Timber Treatment Chemicals, Rubber/Thermoplastics Compounding and Water Chemistry businesses all met the criteria for being reported as discontinued operations. The results of these businesses have been accounted for as discontinued operations in the consolidated financial statements for all periods presented.
�
(a)�Includes the Company�s equity in Adjusted EBITDA of unconsolidated affiliates, including the acquisition of a 49% interest in the Talison Lithium joint venture and other joint ventures for Surface Treatment.
�
As previously announced, on July�15, 2014, Rockwood entered into a merger agreement with Albemarle Corporation (NYSE: ALB) pursuant to which Albemarle will acquire all outstanding shares of Rockwood for consideration of $50.65 in cash and 0.4803 of a share of Albemarle common stock per share of Rockwood common stock. A special shareholder meeting will be held on November�14, 2014 to vote on the adoption of the proposed merger agreement with Albemarle. The transaction is also subject to approval by Albemarle shareholders, regulatory approvals and other customary closing conditions, and is expected to close by the end of the first quarter of 2015.
�
Robert J. Zatta, Chief Executive Officer and Chief Financial Officer, commented, �Surface Treatment and Lithium battery applications, coupled with strong results from our 49% interest in the Talison Lithium joint venture, drove solid performance in the third quarter. Surface Treatment continued to post strong top line demand and Adjusted EBITDA margin of 24%. Lithium, which posted Adjusted EBITDA margin of over 36% (excluding Talison), benefited from over 20% growth in battery grade sales and improved potash sales volume, partially mitigating continued weaker organometallic product sales, primarily butyllithium.
�
�Given the solid year-to-date performance from our core businesses and the Talison joint venture, our outlook for the fourth quarter and full year 2014 remains in line with our expectations.�
�
Business Segment Review
�
Continuing operations for the third quarter and year-to-date net sales and Adjusted EBITDA, as compared with the same periods a year ago, are summarized below:
�
�
Table 2: Net Sales
�
|
� |
� |
� |
� |
� |
� |
%�Change |
� |
� |
� |
� |
� |
%�Change |
� | ||||||||
|
� |
� |
� |
� |
� |
� |
� |
� |
Constant |
� |
� |
� |
� |
� |
� |
� |
Constant |
� | ||||
|
($�in�millions) |
� |
Q3�2014 |
� |
Q3�2013 |
� |
Total |
� |
Currency�(a) |
� |
YTD�2014 |
� |
YTD�2013 |
� |
Total |
� |
Currency�(a) |
� | ||||
|
Lithium |
� |
$ |
117.2 |
� |
$ |
120.3 |
� |
(2.6 |
)% |
(2.1 |
)% |
$ |
349.7 |
� |
$ |
364.5 |
� |
(4.1 |
)% |
(4.8 |
)% |
|
Surface Treatment |
� |
236.3 |
� |
222.3 |
� |
6.3 |
% |
6.7 |
% |
714.2 |
� |
656.1 |
� |
8.9 |
% |
8.9 |
% | ||||
|
Other (c) |
� |
2.8 |
� |
3.2 |
� |
(12.5 |
)% |
(12.5 |
)% |
9.2 |
� |
10.2 |
� |
(9.8 |
)% |
(11.8 |
)% | ||||
|
Net sales |
� |
$ |
356.3 |
� |
$ |
345.8 |
� |
3.0 |
% |
3.5 |
% |
$ |
1,073.1 |
� |
$ |
1,030.8 |
� |
4.1 |
% |
3.9 |
% |
�
Table 3: Adjusted EBITDA
�
|
� |
� |
� |
� |
� |
� |
%�Change |
� |
� |
� |
� |
� |
%�Change |
� | ||||||||
|
� |
� |
� |
� |
� |
� |
� |
� |
Constant |
� |
� |
� |
� |
� |
� |
� |
Constant |
� | ||||
|
($�in�millions) |
� |
Q3�2014 |
� |
Q3�2013 |
� |
Total |
� |
Currency�(a) |
� |
YTD�2014 |
� |
YTD�2013 |
� |
Total |
� |
Currency�(a) |
� | ||||
|
Lithium (b) |
� |
$ |
53.9 |
� |
$ |
43.1 |
� |
25.1 |
% |
25.1 |
% |
$ |
139.8 |
� |
$ |
139.0 |
� |
0.6 |
% |
(0.4 |
)% |
|
Surface Treatment (b) |
� |
57.8 |
� |
50.9 |
� |
13.6 |
% |
13.8 |
% |
167.5 |
� |
145.0 |
� |
15.5 |
% |
15.3 |
% | ||||
|
Other (c) |
� |
(11.1 |
) |
(12.4 |
) |
10.5 |
% |
10.5 |
% |
(37.2 |
) |
(38.9 |
) |
4.4 |
% |
4.9 |
% | ||||
|
Adjusted EBITDA |
� |
$ |
100.6 |
� |
$ |
81.6 |
� |
23.3 |
% |
23.4 |
% |
$ |
270.1 |
� |
$ |
245.1 |
� |
10.2 |
% |
9.6 |
% |
�
(a)�The constant currency effect is the translation impact of the change in the average rate of exchange of another currency to the U.S. dollar for the applicable period as compared to the preceding period. The impact primarily relates to the conversion of the Euro to the U.S. dollar. For the three and nine months ended September�30, 2014 and 2013, the average rate of exchange of the Euro to the U.S. dollar is $1.32 and $1.33, respectively, and $1.36 and $1.32, respectively. For further details, see Appendix Table A-9.
�
(b)�Includes the Company�s equity in Adjusted EBITDA of unconsolidated affiliates, including the acquisition of a 49% interest in the Talison Lithium joint venture and other joint ventures for Surface Treatment.
�
(c)�Other includes the results of the wafer reclaim business, as well as costs of operating the Company�s corporate offices. In the second quarter of 2014, the Company reorganized its Metal Sulfides business and began reporting it within the Surface Treatment segment. The financial statements have been reclassified for all periods presented.
�
Third Quarter Segment Drivers
�
Lithium: Net sales decreased 2.6%, while Adjusted EBITDA increased 25.1%.
�
������������������ Net sales decreased primarily from organometallic products, driven mostly by butyllithium from reduced sales volumes attributable to weaker pricing fundamentals in the Asian market. This was largely offset by higher volumes for battery applications and potash.
������������������ Adjusted EBITDA increased primarily from the contribution of $11.2 million from our 49% ownership interest in the Talison Lithium joint venture that was completed in May�2014, partially offset by lower net sales.
�
Surface Treatment: Net sales and Adjusted EBITDA increased 6.3% and 13.6%, respectively.
�
������������������ Net sales increased primarily due to increased volumes in most markets, particularly driven by higher automotive OEM and automotive components, aerospace, general industry and coil and cold forming applications; and, to a lesser extent, higher selling prices.
������������������ Adjusted EBITDA increased primarily from higher net sales, partially offset by higher selling, general and administrative costs.
�
Conference Call and Webcast
�
On Wednesday, November�5, 2014 at 11:00 am Eastern Time, Rockwood Holdings plans to host its conference call and webcast to discuss these results.
�
�
To access this conference call, the dial-in number in the U.S. is (800) 230-1092, and the international dial-in number is (612) 288-0329. No access code is needed for either call. A listen-only, live webcast of the conference call will also be available at www.rocksp.com.
�
Materials for the call, including the earnings release and presentation, will be available for download on the company�s website on the morning of the call. For persons unable to listen to the live conference call or webcast, a webcast replay of the call will be available on Rockwood�s website.
�
* * *
�
|
Contact: |
Rockwood Holdings,�Inc. |
|
� |
Nahla A. Azmy |
|
� |
Vice President,�Investor Relations�& Communications |
|
� |
Phone: 609-524-1109 |
|
� |
�
* * *
�
Rockwood Holdings,�Inc. based in Princeton, N.J., is a leading global developer, manufacturer and marketer of technologically advanced and high value-added specialty chemicals, with a market capitalization of more than $5 billion. It is a leading integrated and low cost global producer of lithium and lithium compounds used in lithium-ion batteries for electronic devices, alternative transportation vehicles and future energy storage technologies, meeting the significant growth in global demand for these products.�The company is also the second largest global producer of products and services for metal processing, servicing the aerospace, general and European luxury automotive industries.
�
For more information on Rockwood, please visit www.rocksp.com.
�
* * *
�
Non-GAAP Financial Measures
�
This earnings release and presentation includes �non-GAAP financial measures,� such as, a discussion of Adjusted EBITDA, net sales including sales from discontinued operations, free cash flow, and net income/diluted earnings per share from continuing operations excluding certain items. Adjusted EBITDA is not intended to be an alternative to net income as an indicator of operating performance or to cash flows from operating activities as a measure of liquidity. Additionally, Adjusted EBITDA is not intended to be a measure of free cash flow for management�s discretionary use, as it does not consider certain cash requirements such as interest payments, tax payments and debt service requirements. All presentations of consolidated Adjusted EBITDA are calculated using the definition set forth in the Company�s former senior secured credit agreement and indenture governing the 4.625% Senior Notes due 2020 as a basis and reflects management�s interpretations thereof. Adjusted EBITDA, which is referred to as �Consolidated EBITDA,� is defined in the former senior secured credit agreement as consolidated earnings which, as defined in the former senior secured credit agreement, equals income (loss) before the deduction of income taxes of Rockwood Specialties
�
�
Group,�Inc. and the Restricted Subsidiaries (as such term is defined in the former senior secured credit agreement), excluding extraordinary items plus certain items including interest expense, depreciation expense, amortization expense, extraordinary losses and non-recurring charges, losses on asset sales, less certain items including extraordinary gains and non-recurring gains, non-cash gains and gains on asset sales.� We use Adjusted EBITDA on a consolidated basis to assess our operating performance, to calculate performance-based cash bonuses and determine whether certain performance-based options and restricted stock units vest (as such bonuses, options and restricted stock units are tied to Adjusted EBITDA), and as a liquidity measure. In addition, we use Adjusted EBITDA to determine compliance with our debt covenants. We also use Adjusted EBITDA on a segment basis as the primary measure used by our chief operating decision maker to evaluate the ongoing performance of our business segments and reporting units. A reconciliation of net income attributable to Rockwood Holdings,�Inc. shareholders to Adjusted EBITDA is contained in this press release. We strongly urge you to review the reconciliation. In addition, we discuss sales growth in terms of nominal (actual) and net change (nominal less constant currency impacts).
�
Net sales including sales from discontinued operations is not intended to be an alternative for net sales. Management believes that net sales including sales from discontinued operations is meaningful to investors because it provides a view of the Company with respect to its operating results.
�
Free cash flow is not intended to be an alternative to cash flows from operating activities as a measure of liquidity. Our presentation of free cash flow (including continuing and discontinued operations) is defined as net cash from operating activities, less capital expenditures, net of proceeds from government grants received, and other items (including, among others, the cash impact of adjustments made to Adjusted EBITDA under our former senior secured credit agreement ). Management believes that free cash flow is meaningful to investors because it provides an additional measure of liquidity. However, a limitation of free cash flow is that it does not represent the total increase or decrease in cash during the period. An additional limitation associated with the use of this measure is that the term �free cash flow� does not have a standardized meaning. Therefore, other companies may use the same or a similarly named measure but exclude different items or use different computations, which may provide investors a comparable view of our performance in relation to other companies. Management compensates for this limitation by presenting the most comparable GAAP measure, net cash provided by operating activities of continuing operations, with free cash flow within its earnings release and by providing a reconciliation that shows and describes the adjustments made. A reconciliation of net cash provided by operating activities to free cash flow is provided in the accompanying tables.
�
Neither net income and diluted earnings per share from continuing operations excluding certain items is intended to be an alternative for net income or diluted earnings per share. Management believes that net income and diluted earnings per share excluding certain items and net income and diluted earnings per share from continuing operations excluding certain items are meaningful to investors because it provides a view of the Company with respect to ongoing operating results.
�
Reconciliations of these non-GAAP financial measures are included herein. These non-GAAP measures should not be viewed as an alternative to GAAP measures of
�
�
performance. Furthermore, these measures may not be consistent with similar measures provided by other companies.
�
* * *
�
Forward-Looking Statements
�
This press release contains, and management may make, certain �forward-looking statements� within the meaning of the Private Securities Litigation Reform Act of 1995. All statements other than statements of historical facts may be forward-looking statements.� Words such as �may,� �will,� �should,� �could,� �likely,� �anticipates,� �intends,� �believes,� �estimates,� �expects,� �forecasts,� �plans,� �projects,� �predicts� and �outlook� and similar words and expressions are intended to identify forward-looking statements. Examples of our forward-looking statements include, among others, statements relating to our outlook, our future operating results on a segment basis, growth prospects, our future Adjusted EBITDA and free cash flows, our use of cash and our strategic initiatives. Although they reflect Rockwood�s current expectations, they involve a number of known and unknown risks, uncertainties and other factors that could cause actual results to differ materially from those expressed or implied, and are not guarantees of future performance. These risks, uncertainties and other factors include, without limitation, completion of the announced transaction with Albemarle Corporation (�Albemarle�); Rockwood�s business strategy; our uses of the cash and cash equivalents from the completed divestitures; the prospects of and our outlook for our businesses; changes in general economic conditions in Europe and North America and in other locations in which Rockwood currently does business; competitive pricing or product development activities affecting demand for Rockwood�s products; technological changes affecting production of Rockwood�s materials; fluctuations in interest rates, exchange rates and currency values; availability and pricing of raw materials; governmental and environmental regulations and changes in those regulations; fluctuations in energy prices; changes in the end-use markets in which Rockwood�s products are sold; hazards associated with chemicals manufacturing; Rockwood�s ability to access capital markets; Rockwood�s high level of indebtedness; risks associated with negotiating, consummating and integrating acquisitions; risks associated with competition and the introduction of new competing products, especially from the Asia-Pacific region; risks associated with international sales and operations; risks associated with information security and the risks, uncertainties and other factors discussed under �Risk Factors� and �Management�s Discussion and Analysis of Financial Condition and Results of Operations� in Rockwood�s periodic reports filed with or furnished to the Securities and Exchange Commission.
�
This press release also contains certain forward-looking statements with respect to the financial condition, results of operations and business of Albemarle, Rockwood and the combined businesses of Albemarle and Rockwood and with respect to the transaction and the anticipated consequences and benefits of the transaction, the targeted close date for the transaction, product development, changes in productivity, market trends, price, expected growth and earnings, cash flow generation, costs and cost synergies, portfolio diversification, economic trends and outlook.� Such statements involve known and unknown risks, uncertainties, and other factors which may cause the actual results, performance, or achievements of Albemarle or Rockwood to be materially different from future results, performance or achievements expressed or implied by such forward-looking statements.� Such factors include, without limitation:
�
�
the receipt and timing of necessary regulatory approvals; the ability to finance the transaction; the ability to successfully operate and integrate Rockwood�s operations and realize estimated synergies; changes in economic and business conditions; changes in financial and operating performance of major customers and industries and markets served by Albemarle or Rockwood; the timing of orders received from customers; the gain or loss of significant customers; competition from other manufacturers; changes in the demand for products; limitations or prohibitions on the manufacture and sale of products; availability of raw materials; changes in the cost of raw materials and energy; changes in markets in general; changes in laws and government regulation impacting operations or products; the occurrence of claims or litigation; the occurrence of natural disasters; political unrest affecting the global economy; political instability affecting manufacturing operations or joint ventures; changes in accounting standards; changes in the jurisdictional mix of the earnings of Albemarle or Rockwood and changes in tax laws and rates; volatility and substantial uncertainties in the debt and equity markets; technology or intellectual property infringement; and decisions that Albemarle or Rockwood may make in the future.� In addition, certain factors that could cause actual results to differ materially from these forward-looking statements are listed from time to time in Albemarle�s SEC reports, including, but not limited to, in the section entitled �Item 1A. Risk Factors� in the Annual Report on Form�10-K filed by Albemarle with the SEC on February�25, 2014.
�
These forward-looking statements speak only as of the date of this press release. Rockwood expressly disclaims any obligation or undertaking to disseminate any updates or revisions to any forward-looking statement contained herein to reflect any change in its expectations with regard thereto or any change in events, conditions or circumstances on which any such statement is based.
�
* * *
�
�
Rockwood Holdings,�Inc. and Subsidiaries
Consolidated Statements of Operations
(Dollars in millions, except per share amounts; shares in thousands)
(Unaudited)
�
|
� |
� |
Three�months�ended |
� |
Nine�months�ended |
� | ||||||||
|
� |
� |
September�30, |
� |
September�30, |
� | ||||||||
|
� |
� |
2014 |
� |
2013 |
� |
2014 |
� |
2013 |
� | ||||
|
Net sales |
� |
$ |
356.3 |
� |
$ |
345.8 |
� |
$ |
1,073.1 |
� |
$ |
1,030.8 |
� |
|
Cost of products sold |
� |
193.4 |
� |
193.1 |
� |
585.3 |
� |
567.5 |
� | ||||
|
Gross profit |
� |
162.9 |
� |
152.7 |
� |
487.8 |
� |
463.3 |
� | ||||
|
� |
� |
� |
� |
� |
� |
� |
� |
� |
� | ||||
|
Selling, general and administrative expenses |
� |
113.8 |
� |
99.8 |
� |
333.3 |
� |
303.0 |
� | ||||
|
Equity in earnings of unconsolidated affiliates |
� |
(5.1 |
) |
(2.3 |
) |
(9.9 |
) |
(7.4 |
) | ||||
|
Gain on previously held equity investment |
� |
� |
� |
(16.0 |
) |
� |
� |
(16.0 |
) | ||||
|
Restructuring and other severance costs |
� |
1.4 |
� |
4.6 |
� |
7.0 |
� |
13.2 |
� | ||||
|
Asset write-downs and other |
� |
0.4 |
� |
(0.7 |
) |
2.1 |
� |
4.0 |
� | ||||
|
Operating income |
� |
52.4 |
� |
67.3 |
� |
155.3 |
� |
166.5 |
� | ||||
|
� |
� |
� |
� |
� |
� |
� |
� |
� |
� | ||||
|
Other income (expenses), net: |
� |
� |
� |
� |
� |
� |
� |
� |
� | ||||
|
Interest expense, net |
� |
(13.5 |
) |
(21.2 |
) |
(41.3 |
) |
(67.9 |
) | ||||
|
Loss on early extinguishment/modification of debt |
� |
� |
� |
(15.5 |
) |
� |
� |
(15.5 |
) | ||||
|
Foreign exchange gain (loss) on financing activities, net |
� |
55.1 |
� |
(31.2 |
) |
60.9 |
� |
(41.7 |
) | ||||
|
Other, net |
� |
(0.2 |
) |
� |
� |
(0.2 |
) |
� |
� | ||||
|
Other income (expenses), net |
� |
41.4 |
� |
(67.9 |
) |
19.4 |
� |
(125.1 |
) | ||||
|
� |
� |
� |
� |
� |
� |
� |
� |
� |
� | ||||
|
Income (loss) from continuing operations before taxes |
� |
93.8 |
� |
(0.6 |
) |
174.7 |
� |
41.4 |
� | ||||
|
Income tax provision (benefit) |
� |
39.4 |
� |
(9.0 |
) |
64.5 |
� |
0.8 |
� | ||||
|
Income from continuing operations |
� |
54.4 |
� |
8.4 |
� |
110.2 |
� |
40.6 |
� | ||||
|
Income (loss) from discontinued operations, net of tax (a) |
� |
33.5 |
� |
(60.9 |
) |
4.4 |
� |
(45.1 |
) | ||||
|
Gain on sale of discontinued operations, net of tax |
� |
� |
� |
1,163.8 |
� |
2.1 |
� |
1,163.8 |
� | ||||
|
Net income |
� |
87.9 |
� |
1,111.3 |
� |
116.7 |
� |
1,159.3 |
� | ||||
|
Net (income) loss attributable to noncontrolling interest - discontinued operations |
� |
(2.0 |
) |
(0.1 |
) |
(4.9 |
) |
0.8 |
� | ||||
|
Net income attributable to Rockwood Holdings,�Inc. stockholders |
� |
$ |
85.9 |
� |
$ |
1,111.2 |
� |
$ |
111.8 |
� |
$ |
1,160.1 |
� |
|
� |
� |
� |
� |
� |
� |
� |
� |
� |
� | ||||
|
Amounts attributable to Rockwood Holdings,�Inc. stockholders: |
� |
� |
� |
� |
� |
� |
� |
� |
� | ||||
|
Income from continuing operations |
� |
$ |
54.4 |
� |
$ |
8.4 |
� |
$ |
110.2 |
� |
$ |
40.6 |
� |
|
Income from discontinued operations |
� |
31.5 |
� |
1,102.8 |
� |
1.6 |
� |
1,119.5 |
� | ||||
|
Net income |
� |
$ |
85.9 |
� |
$ |
1,111.2 |
� |
$ |
111.8 |
� |
$ |
1,160.1 |
� |
|
� |
� |
� |
� |
� |
� |
� |
� |
� |
� | ||||
|
Basic earnings per share attributable to Rockwood Holdings,�Inc. stockholders: |
� |
� |
� |
� |
� |
� |
� |
� |
� | ||||
|
Earnings from continuing operations |
� |
$ |
0.76 |
� |
$ |
0.11 |
� |
$ |
1.52 |
� |
$ |
0.53 |
� |
|
Earnings from discontinued operations |
� |
0.45 |
� |
14.85 |
� |
0.02 |
� |
14.61 |
� | ||||
|
Basic earnings per share |
� |
$ |
1.21 |
� |
$ |
14.96 |
� |
$ |
1.54 |
� |
$ |
15.14 |
� |
|
� |
� |
� |
� |
� |
� |
� |
� |
� |
� | ||||
|
Diluted earnings per share attributable to Rockwood Holdings,�Inc. stockholders: |
� |
� |
� |
� |
� |
� |
� |
� |
� | ||||
|
Earnings from continuing operations |
� |
$ |
0.75 |
� |
$ |
0.11 |
� |
$ |
1.50 |
� |
$ |
0.52 |
� |
|
Earnings from discontinued operations |
� |
0.44 |
� |
14.53 |
� |
0.02 |
� |
14.30 |
� | ||||
|
Diluted earnings per share |
� |
$ |
1.19 |
� |
$ |
14.64 |
� |
$ |
1.52 |
� |
$ |
14.82 |
� |
|
� |
� |
� |
� |
� |
� |
� |
� |
� |
� | ||||
|
Dividends declared per share of common stock |
� |
$ |
0.45 |
� |
$ |
0.45 |
� |
$ |
1.35 |
� |
$ |
1.25 |
� |
|
� |
� |
� |
� |
� |
� |
� |
� |
� |
� | ||||
|
Weighted average number of basic shares outstanding |
� |
71,239 |
� |
74,262 |
� |
72,504 |
� |
76,611 |
� | ||||
|
Weighted average number of diluted shares outstanding |
� |
72,176 |
� |
75,906 |
� |
73,547 |
� |
78,264 |
� | ||||
�
(a)�Includes the expected loss on the sale of the TiO2 Pigments and Other Businesses.
�
�
Rockwood Holdings,�Inc. and Subsidiaries
Consolidated Balance Sheets
(Dollars in millions, except per share amounts; shares in thousands)
(Unaudited)
�
|
� |
� |
September�30, |
� |
December�31, |
� | ||
|
� |
� |
2014 |
� |
2013 |
� | ||
|
ASSETS |
� |
� |
� |
� |
� | ||
|
Current assets: |
� |
� |
� |
� |
� | ||
|
Cash and cash equivalents |
� |
$ |
710.0 |
� |
$ |
1,522.8 |
� |
|
Accounts receivable, net |
� |
236.4 |
� |
228.1 |
� | ||
|
Inventories |
� |
227.5 |
� |
228.2 |
� | ||
|
Deferred income taxes |
� |
51.0 |
� |
45.4 |
� | ||
|
Prepaid expenses and other current assets |
� |
48.8 |
� |
90.1 |
� | ||
|
Assets of discontinued operations |
� |
1,505.3 |
� |
1,549.1 |
� | ||
|
Total current assets |
� |
2,779.0 |
� |
3,663.7 |
� | ||
|
Property, plant and equipment, net |
� |
871.1 |
� |
842.8 |
� | ||
|
Goodwill |
� |
609.2 |
� |
659.6 |
� | ||
|
Other intangible assets, net |
� |
110.5 |
� |
127.9 |
� | ||
|
Deferred financing costs, net |
� |
15.9 |
� |
17.9 |
� | ||
|
Deferred income taxes |
� |
146.1 |
� |
156.5 |
� | ||
|
Investment in unconsolidated affiliates |
� |
522.1 |
� |
34.2 |
� | ||
|
Other assets |
� |
28.0 |
� |
29.7 |
� | ||
|
Total assets |
� |
$ |
5,081.9 |
� |
$ |
5,532.3 |
� |
|
LIABILITIES |
� |
� |
� |
� |
� | ||
|
Current liabilities: |
� |
� |
� |
� |
� | ||
|
Accounts payable |
� |
$ |
79.0 |
� |
$ |
92.2 |
� |
|
Income taxes payable |
� |
34.8 |
� |
13.5 |
� | ||
|
Accrued compensation |
� |
73.4 |
� |
70.0 |
� | ||
|
Accrued expenses and other current liabilities |
� |
104.2 |
� |
89.0 |
� | ||
|
Deferred income taxes |
� |
3.3 |
� |
2.3 |
� | ||
|
Long-term debt, current portion |
� |
9.5 |
� |
10.3 |
� | ||
|
Liabilities of discontinued operations |
� |
452.0 |
� |
486.5 |
� | ||
|
Total current liabilities |
� |
756.2 |
� |
763.8 |
� | ||
|
Long-term debt |
� |
1,278.8 |
� |
1,285.1 |
� | ||
|
Pension and related liabilities |
� |
245.7 |
� |
268.9 |
� | ||
|
Deferred income taxes |
� |
41.9 |
� |
38.4 |
� | ||
|
Other liabilities |
� |
90.8 |
� |
102.7 |
� | ||
|
Total liabilities |
� |
2,413.4 |
� |
2,458.9 |
� | ||
|
Restricted stock units |
� |
22.2 |
� |
24.2 |
� | ||
|
EQUITY |
� |
� |
� |
� |
� | ||
|
Rockwood Holdings,�Inc. stockholders� equity: |
� |
� |
� |
� |
� | ||
|
Common stock ($0.01 par value, 400,000 shares authorized, 80,541 shares issued and 71,241 shares outstanding at September�30, 2014; 400,000 shares authorized, 80,219 shares issued and 73,892 shares outstanding at December�31, 2013) |
� |
0.8 |
� |
0.8 |
� | ||
|
Paid-in capital |
� |
1,275.3 |
� |
1,269.8 |
� | ||
|
Accumulated other comprehensive (loss) income |
� |
(102.6 |
) |
103.7 |
� | ||
|
Retained earnings |
� |
1,936.0 |
� |
1,923.1 |
� | ||
|
Treasury stock, at cost (9,300 shares and 6,327 shares, respectively) |
� |
(616.0 |
) |
(401.3 |
) | ||
|
Total Rockwood Holdings,�Inc. stockholders� equity |
� |
2,493.5 |
� |
2,896.1 |
� | ||
|
Noncontrolling interest |
� |
152.8 |
� |
153.1 |
� | ||
|
Total equity |
� |
2,646.3 |
� |
3,049.2 |
� | ||
|
Total liabilities and equity |
� |
$ |
5,081.9 |
� |
$ |
5,532.3 |
� |
�
�
Rockwood Holdings,�Inc. and Subsidiaries
Consolidated Statements of Cash Flows
(Dollars in millions)
(Unaudited)
�
�
�
�
Appendix Table A-1: Reconciliation of Income (Loss) from Continuing Operations before Taxes to Adjusted EBITDA by Segment
�
|
� |
� |
� |
� |
Surface |
� |
� |
� |
Discontinued |
� |
� |
� | |||||
|
($�in�millions) |
� |
Lithium |
� |
Treatment |
� |
Other |
� |
Operations |
� |
Consolidated |
� | |||||
|
Three months ended September�30, 2014 |
� |
� |
� |
� |
� |
� |
� |
� |
� |
� |
� | |||||
|
� |
� |
� |
� |
� |
� |
� |
� |
� |
� |
� |
� | |||||
|
Income from continuing operations before taxes |
� |
$ |
33.7 |
� |
$ |
42.5 |
� |
$ |
17.6 |
� |
$ |
� |
� |
$ |
93.8 |
� |
|
Interest (income) expense, net |
� |
(0.4 |
) |
2.9 |
� |
11.0 |
� |
� |
� |
13.5 |
� | |||||
|
Depreciation and amortization |
� |
11.1 |
� |
8.7 |
� |
4.8 |
� |
� |
� |
24.6 |
� | |||||
|
Restructuring and other severance costs |
� |
0.1 |
� |
1.3 |
� |
� |
� |
� |
� |
1.4 |
� | |||||
|
Equity investment adjustments (a) |
� |
8.7 |
� |
0.8 |
� |
� |
� |
� |
� |
9.5 |
� | |||||
|
Systems/organization establishment expenses |
� |
0.6 |
� |
� |
� |
0.1 |
� |
� |
� |
0.7 |
� | |||||
|
Acquisition and disposal costs |
� |
0.1 |
� |
0.2 |
� |
11.0 |
� |
� |
� |
11.3 |
� | |||||
|
Asset write-downs and other |
� |
0.2 |
� |
0.3 |
� |
(0.1 |
) |
� |
� |
0.4 |
� | |||||
|
Foreign exchange (gain) loss on financing activities, net |
� |
(0.2 |
) |
0.7 |
� |
(55.6 |
) |
� |
� |
(55.1 |
) | |||||
|
Other |
� |
� |
� |
0.4 |
� |
0.1 |
� |
� |
� |
0.5 |
� | |||||
|
Adjusted EBITDA from continuing operations |
� |
53.9 |
� |
57.8 |
� |
(11.1 |
) |
� |
� |
100.6 |
� | |||||
|
Discontinued operations |
� |
� |
� |
� |
� |
� |
� |
39.6 |
� |
39.6 |
� | |||||
|
Total Adjusted EBITDA |
� |
$ |
53.9 |
� |
$ |
57.8 |
� |
$ |
(11.1 |
) |
$ |
39.6 |
� |
$ |
140.2 |
� |
�
|
� |
� |
� |
� |
Surface |
� |
� |
� |
Discontinued |
� |
� |
� | |||||
|
($�in�millions) |
� |
Lithium |
� |
Treatment |
� |
Other |
� |
Operations |
� |
Consolidated |
� | |||||
|
Three months ended September�30, 2013 |
� |
� |
� |
� |
� |
� |
� |
� |
� |
� |
� | |||||
|
� |
� |
� |
� |
� |
� |
� |
� |
� |
� |
� |
� | |||||
|
Income (loss) from continuing operations before taxes |
� |
$ |
27.6 |
� |
$ |
48.3 |
� |
$ |
(76.5 |
) |
$ |
� |
� |
$ |
(0.6 |
) |
|
Interest expense, net |
� |
0.5 |
� |
2.9 |
� |
17.8 |
� |
� |
� |
21.2 |
� | |||||
|
Depreciation and amortization |
� |
11.6 |
� |
8.8 |
� |
2.4 |
� |
� |
� |
22.8 |
� | |||||
|
Restructuring and other severance costs |
� |
1.4 |
� |
1.0 |
� |
2.2 |
� |
� |
� |
4.6 |
� | |||||
|
Systems/organization establishment expenses |
� |
0.2 |
� |
0.1 |
� |
� |
� |
� |
� |
0.3 |
� | |||||
|
Acquisition and disposal costs |
� |
� |
� |
0.7 |
� |
1.5 |
� |
� |
� |
2.2 |
� | |||||
|
Loss on early extinguishment/modification of debt |
� |
2.2 |
� |
3.2 |
� |
10.1 |
� |
� |
� |
15.5 |
� | |||||
|
Asset write-downs and other |
� |
(0.8 |
) |
0.1 |
� |
� |
� |
� |
� |
(0.7 |
) | |||||
|
Gain on previously held equity investment |
� |
� |
� |
(16.0 |
) |
� |
� |
� |
� |
(16.0 |
) | |||||
|
Foreign exchange loss on financing activities, net |
� |
0.4 |
� |
1.3 |
� |
29.5 |
� |
� |
� |
31.2 |
� | |||||
|
Other |
� |
� |
� |
0.5 |
� |
0.6 |
� |
� |
� |
1.1 |
� | |||||
|
Adjusted EBITDA from continuing operations |
� |
43.1 |
� |
50.9 |
� |
(12.4 |
) |
� |
� |
81.6 |
� | |||||
|
Discontinued operations |
� |
� |
� |
� |
� |
� |
� |
76.2 |
� |
76.2 |
� | |||||
|
Total Adjusted EBITDA |
� |
$ |
43.1 |
� |
$ |
50.9 |
� |
$ |
(12.4 |
) |
$ |
76.2 |
� |
$ |
157.8 |
� |
�
(a)�This represents the adjustments to the EBITDA of unconsolidated affiliates included in the calculation of Adjusted EBITDA, consistent with the adjustments made on a consolidated basis:
�
|
� |
� |
� |
� |
Surface |
� |
� |
� |
� |
� |
� |
� | |||
|
($�in�millions) |
� |
Lithium�* |
� |
Treatment |
� |
Consolidated |
� |
� |
� |
� |
� | |||
|
Three months ended September�30, 2014 |
� |
� |
� |
� |
� |
� |
� |
� |
� |
� |
� | |||
|
� |
� |
� |
� |
� |
� |
� |
� |
� |
� |
� |
� | |||
|
Equity in earnings of unconsolidated affiliates |
� |
$ |
2.7 |
� |
$ |
2.4 |
� |
$ |
5.1 |
� |
� |
� |
� |
� |
|
� |
� |
� |
� |
� |
� |
� |
� |
� |
� |
� |
� | |||
|
Interest income, net |
� |
(0.4 |
) |
� |
� |
(0.4 |
) |
� |
� |
� |
� | |||
|
Depreciation and amortization |
� |
1.9 |
� |
0.2 |
� |
2.1 |
� |
� |
� |
� |
� | |||
|
Income tax provision |
� |
1.0 |
� |
0.7 |
� |
1.7 |
� |
� |
� |
� |
� | |||
|
Acquisition method inventory charges |
� |
6.2 |
� |
� |
� |
6.2 |
� |
� |
� |
� |
� | |||
|
Other |
� |
� |
� |
(0.1 |
) |
(0.1 |
) |
� |
� |
� |
� | |||
|
Total adjustments |
� |
8.7 |
� |
0.8 |
� |
9.5 |
� |
� |
� |
� |
� | |||
|
� |
� |
� |
� |
� |
� |
� |
� |
� |
� |
� |
� | |||
|
Adjusted EBITDA of unconsolidated affiliates |
� |
$ |
11.4 |
� |
$ |
3.2 |
� |
$ |
14.6 |
� |
� |
� |
� |
� |
�
* Represents adjustments related to the acquisition of a 49% interest in the joint venture related to Talison Lithium in May�2014.
�
�
Appendix Table A-2: Reconciliation of Income (Loss) from Continuing Operations before Taxes to Adjusted EBITDA by Segment
�
|
� |
� |
� |
� |
Surface |
� |
� |
� |
Discontinued |
� |
� |
� | |||||
|
($�in�millions) |
� |
Lithium |
� |
Treatment |
� |
Other |
� |
Operations |
� |
Consolidated |
� | |||||
|
Nine months ended September�30, 2014 |
� |
� |
� |
� |
� |
� |
� |
� |
� |
� |
� | |||||
|
� |
� |
� |
� |
� |
� |
� |
� |
� |
� |
� |
� | |||||
|
Income (loss) from continuing operations before taxes |
� |
$ |
92.2 |
� |
$ |
122.8 |
� |
$ |
(40.3 |
) |
$ |
� |
� |
$ |
174.7 |
� |
|
Interest (income) expense, net |
� |
(0.9 |
) |
9.0 |
� |
33.2 |
� |
� |
� |
41.3 |
� | |||||
|
Depreciation and amortization |
� |
34.7 |
� |
26.2 |
� |
14.8 |
� |
� |
� |
75.7 |
� | |||||
|
Restructuring and other severance costs |
� |
3.7 |
� |
3.3 |
� |
� |
� |
� |
� |
7.0 |
� | |||||
|
Equity investment adjustments (a) |
� |
11.8 |
� |
2.9 |
� |
� |
� |
� |
� |
14.7 |
� | |||||
|
Systems/organization establishment expenses |
� |
1.7 |
� |
0.3 |
� |
0.1 |
� |
� |
� |
2.1 |
� | |||||
|
Acquisition and disposal costs |
� |
0.1 |
� |
0.9 |
� |
11.9 |
� |
� |
� |
12.9 |
� | |||||
|
Asset write-downs and other |
� |
1.8 |
� |
0.2 |
� |
0.1 |
� |
� |
� |
2.1 |
� | |||||
|
Foreign exchange (gain) loss on financing activities, net |
� |
(5.3 |
) |
1.5 |
� |
(57.1 |
) |
� |
� |
(60.9 |
) | |||||
|
Other |
� |
� |
� |
0.4 |
� |
0.1 |
� |
� |
� |
0.5 |
� | |||||
|
Adjusted EBITDA from continuing operations |
� |
139.8 |
� |
167.5 |
� |
(37.2 |
) |
� |
� |
270.1 |
� | |||||
|
Discontinued operations |
� |
� |
� |
� |
� |
� |
� |
138.9 |
� |
138.9 |
� | |||||
|
Total Adjusted EBITDA |
� |
$ |
139.8 |
� |
$ |
167.5 |
� |
$ |
(37.2 |
) |
$ |
138.9 |
� |
$ |
409.0 |
� |
�
|
� |
� |
� |
� |
Surface |
� |
� |
� |
Discontinued |
� |
� |
� | |||||
|
($�in�millions) |
� |
Lithium |
� |
Treatment |
� |
Other |
� |
Operations |
� |
Consolidated |
� | |||||
|
Nine months ended September�30, 2013 |
� |
� |
� |
� |
� |
� |
� |
� |
� |
� |
� | |||||
|
� |
� |
� |
� |
� |
� |
� |
� |
� |
� |
� |
� | |||||
|
Income (loss) from continuing operations before taxes |
� |
$ |
87.2 |
� |
$ |
114.8 |
� |
$ |
(160.6 |
) |
$ |
� |
� |
$ |
41.4 |
� |
|
Interest expense, net |
� |
1.9 |
� |
9.0 |
� |
57.0 |
� |
� |
� |
67.9 |
� | |||||
|
Depreciation and amortization |
� |
34.5 |
� |
26.2 |
� |
7.3 |
� |
� |
� |
68.0 |
� | |||||
|
Restructuring and other severance costs |
� |
5.8 |
� |
4.4 |
� |
3.0 |
� |
� |
� |
13.2 |
� | |||||
|
Systems/organization establishment expenses |
� |
0.7 |
� |
0.8 |
� |
� |
� |
� |
� |
1.5 |
� | |||||
|
Acquisition and disposal costs |
� |
0.1 |
� |
1.5 |
� |
4.1 |
� |
� |
� |
5.7 |
� | |||||
|
Loss on early extinguishment/modification of debt |
� |
2.2 |
� |
3.2 |
� |
10.1 |
� |
� |
� |
15.5 |
� | |||||
|
Asset write-downs and other |
� |
3.9 |
� |
0.1 |
� |
� |
� |
� |
� |
4.0 |
� | |||||
|
Gain on previously held equity investment |
� |
� |
� |
(16.0 |
) |
� |
� |
� |
� |
(16.0 |
) | |||||
|
Foreign exchange loss on financing activities, net |
� |
2.7 |
� |
� |
� |
39.0 |
� |
� |
� |
41.7 |
� | |||||
|
Other |
� |
� |
� |
1.0 |
� |
1.2 |
� |
� |
� |
2.2 |
� | |||||
|
Adjusted EBITDA from continuing operations |
� |
139.0 |
� |
145.0 |
� |
(38.9 |
) |
� |
� |
245.1 |
� | |||||
|
Discontinued operations |
� |
� |
� |
� |
� |
� |
� |
244.3 |
� |
244.3 |
� | |||||
|
Total Adjusted EBITDA |
� |
$ |
139.0 |
� |
$ |
145.0 |
� |
$ |
(38.9 |
) |
$ |
244.3 |
� |
$ |
489.4 |
� |
�
(a)�This represents the adjustments to the EBITDA of unconsolidated affiliates included in the calculation of Adjusted EBITDA, consistent with the adjustments made on a consolidated basis:
�
|
� |
� |
� |
� |
Surface |
� |
� |
� | |||
|
($�in�millions) |
� |
Lithium�* |
� |
Treatment |
� |
Consolidated |
� | |||
|
Nine months ended September�30, 2014 |
� |
� |
� |
� |
� |
� |
� | |||
|
� |
� |
� |
� |
� |
� |
� |
� | |||
|
Equity in earnings of unconsolidated affiliates |
� |
$ |
3.1 |
� |
$ |
6.8 |
� |
$ |
9.9 |
� |
|
� |
� |
� |
� |
� |
� |
� |
� | |||
|
Interest income, net |
� |
(0.5 |
) |
(0.2 |
) |
(0.7 |
) | |||
|
Depreciation and amortization |
� |
2.3 |
� |
0.5 |
� |
2.8 |
� | |||
|
Income tax provision |
� |
1.1 |
� |
2.5 |
� |
3.6 |
� | |||
|
Acquisition method inventory charges |
� |
8.9 |
� |
� |
� |
8.9 |
� | |||
|
Other |
� |
� |
� |
0.1 |
� |
0.1 |
� | |||
|
Total adjustments |
� |
11.8 |
� |
2.9 |
� |
14.7 |
� | |||
|
� |
� |
� |
� |
� |
� |
� |
� | |||
|
Adjusted EBITDA of unconsolidated affiliates |
� |
$ |
14.9 |
� |
$ |
9.7 |
� |
$ |
24.6 |
� |
�
* Represents adjustments related to the acquisition of a 49% interest in the joint venture related to Talison Lithium in May�2014.
�
�
Appendix Table A-3: Consolidated Reconciliation of Net Income/Diluted Earnings Per Share from Continuing Operations as Reported to Net Income/Diluted Earnings Per Share from Continuing Operations as Adjusted
�
|
� |
� |
Three�Months�Ended |
� |
Three�Months�Ended |
� | ||||||||
|
� |
� |
September�30,�2014 |
� |
September�30,�2013 |
� | ||||||||
|
($�in�millions,�except�per�share�amounts;�shares�in�thousands) |
� |
Net�Income |
� |
Diluted�EPS |
� |
Net�Income |
� |
Diluted�EPS |
� | ||||
|
As reported - Continuing Operations |
� |
$ |
54.4 |
� |
$ |
0.75 |
� |
$ |
8.4 |
� |
$ |
0.11 |
� |
|
� |
� |
� |
� |
� |
� |
� |
� |
� |
� | ||||
|
Adjustments from continuing operations: |
� |
� |
� |
� |
� |
� |
� |
� |
� | ||||
|
Foreign exchange (gain) loss on financing activities, net |
� |
(33.3 |
) |
(0.46 |
) |
20.7 |
� |
0.27 |
� | ||||
|
Acquisition and disposal costs |
� |
9.5 |
� |
0.13 |
� |
1.5 |
� |
0.02 |
� | ||||
|
Impact of other tax related items |
� |
7.5 |
� |
0.10 |
� |
1.1 |
� |
0.01 |
� | ||||
|
Adjustments - equity in earnings of unconsolidated affiliates * |
� |
4.2 |
� |
0.06 |
� |
� |
� |
� |
� | ||||
|
Restructuring and other severance costs |
� |
1.0 |
� |
0.02 |
� |
3.3 |
� |
0.04 |
� | ||||
|
Non-cash charge related to divested businesses |
� |
0.9 |
� |
0.01 |
� |
� |
� |
� |
� | ||||
|
Gain on previously held equity interest |
� |
� |
� |
� |
� |
(16.0 |
) |
(0.21 |
) | ||||
|
Loss on early extinguishment/modification of debt |
� |
� |
� |
� |
� |
10.5 |
� |
0.14 |
� | ||||
|
Other |
� |
1.1 |
� |
0.02 |
� |
0.4 |
� |
0.01 |
� | ||||
|
Net charges from continuing operations |
� |
(9.1 |
) |
(0.12 |
) |
21.5 |
� |
0.28 |
� | ||||
|
� |
� |
� |
� |
� |
� |
� |
� |
� |
� | ||||
|
As adjusted - Continuing Operations |
� |
$ |
45.3 |
� |
$ |
0.63 |
� |
$ |
29.9 |
� |
$ |
0.39 |
� |
|
� |
� |
� |
� |
� |
� |
� |
� |
� |
� | ||||
|
Weighted average number of diluted shares outstanding |
� |
� |
� |
72,176 |
� |
� |
� |
75,906 |
� | ||||
�
* Primarily represents acquisition method inventory charges from our 49% equity interest in Talison Lithium.
�
The tax effects of the adjustments are provisions of $24.6 million and benefits of $16.7 million for the three months ended September�30, 2014 and 2013, respectively, based on the statutory tax rate in the various tax jurisdictions in which the adjustments occurred, adjusted for the impact of certain valuation allowances.
�
�
Appendix Table A-4: Consolidated Reconciliation of Net Income/Diluted Earnings Per Share from Continuing Operations as Reported to Net Income/Diluted Earnings Per Share from Continuing Operations as Adjusted
�
|
� |
� |
Nine�Months�Ended |
� |
Nine�Months�Ended |
� | ||||||||
|
� |
� |
September�30,�2014 |
� |
September�30,�2013 |
� | ||||||||
|
($�in�millions,�except�per�share�amounts;�shares�in�thousands) |
� |
Net�Income |
� |
Diluted�EPS |
� |
Net�Income |
� |
Diluted�EPS |
� | ||||
|
As reported - Continuing Operations |
� |
$ |
110.2 |
� |
$ |
1.50 |
� |
$ |
40.6 |
� |
$ |
0.52 |
� |
|
� |
� |
� |
� |
� |
� |
� |
� |
� |
� | ||||
|
Adjustments from continuing operations: |
� |
� |
� |
� |
� |
� |
� |
� |
� | ||||
|
Foreign exchange (gain) loss on financing activities, net |
� |
(37.3 |
) |
(0.51 |
) |
28.1 |
� |
0.36 |
� | ||||
|
Tax on foreign exchange gain * |
� |
12.8 |
� |
0.17 |
� |
� |
� |
� |
� | ||||
|
Acquisition and disposal costs |
� |
10.4 |
� |
0.14 |
� |
4.1 |
� |
0.05 |
� | ||||
|
Non-cash charge related to divested businesses |
� |
6.4 |
� |
0.09 |
� |
� |
� |
� |
� | ||||
|
Adjustments - equity in earnings of unconsolidated affiliates ** |
� |
6.3 |
� |
0.09 |
� |
� |
� |
� |
� | ||||
|
Restructuring and other severance costs |
� |
6.0 |
� |
0.08 |
� |
9.8 |
� |
0.13 |
� | ||||
|
Impact of other tax related items |
� |
4.9 |
� |
0.07 |
� |
1.1 |
� |
0.01 |
� | ||||
|
Asset write-downs |
� |
1.6 |
� |
0.02 |
� |
2.6 |
� |
0.03 |
� | ||||
|
Systems/organization establishment expenses |
� |
1.5 |
� |
0.02 |
� |
1.0 |
� |
0.01 |
� | ||||
|
Gain on previously held equity interest |
� |
� |
� |
� |
� |
(16.0 |
) |
(0.20 |
) | ||||
|
Loss on early extinguishment/modification of debt |
� |
� |
� |
� |
� |
10.5 |
� |
0.13 |
� | ||||
|
Other |
� |
0.2 |
� |
� |
� |
1.5 |
� |
0.02 |
� | ||||
|
Net charges from continuing operations |
� |
12.8 |
� |
0.17 |
� |
42.7 |
� |
0.54 |
� | ||||
|
� |
� |
� |
� |
� |
� |
� |
� |
� |
� | ||||
|
As adjusted - Continuing Operations |
� |
$ |
123.0 |
� |
$ |
1.67 |
� |
$ |
83.3 |
� |
$ |
1.06 |
� |
|
� |
� |
� |
� |
� |
� |
� |
� |
� |
� | ||||
|
Weighted average number of diluted shares outstanding |
� |
� |
� |
73,547 |
� |
� |
� |
78,264 |
� | ||||
�
* Relates to the impact of a tax provision recorded on foreign exchange gains incurred in connection with the repayment of intercompany loans that were formerly deemed to be of a long-term investment nature.
�
** Primarily represents acquisition method inventory charges from our 49% equity interest in Talison Lithium.
�
The tax effects of the adjustments are provisions of $33.7 million and benefits of $26.4 million for the nine months ended September�30, 2014 and 2013, respectively, based on the statutory tax rate in the various tax jurisdictions in which the adjustments occurred, adjusted for the impact of certain valuation allowances.
�
�
Appendix Table A-5: Consolidated Reconciliation of Net Income/Diluted Earnings Per Share from Continuing Operations as Reported to Net Income/Diluted Earnings Per Share from Continuing Operations as Adjusted
�
|
� |
� |
Three�months�ended�September�30,�2014 |
� | ||||||||||||
|
($�in�millions;�except�per�share�amounts) |
� |
Income�from |
� |
Income |
� |
Income�from |
� |
Effective�tax |
� |
Diluted�EPS�(a) |
� | ||||
|
As reported |
� |
$ |
93.8 |
� |
$ |
39.4 |
� |
$ |
54.4 |
� |
42.0 |
% |
$ |
0.75 |
� |
|
� |
� |
� |
� |
� |
� |
� |
� |
� |
� |
� |
� | ||||
|
Adjustments from continuing operations: |
� |
� |
� |
� |
� |
� |
� |
� |
� |
� |
� | ||||
|
Foreign exchange gain on financing activities, net |
� |
(55.1 |
) |
(21.8 |
) |
(33.3 |
) |
� |
� |
(0.46 |
) | ||||
|
Acquisition and disposal costs |
� |
11.3 |
� |
1.8 |
� |
9.5 |
� |
� |
� |
0.13 |
� | ||||
|
Impact of other tax related items |
� |
� |
� |
(7.5 |
) |
7.5 |
� |
� |
� |
0.10 |
� | ||||
|
Adjustments - equity in earnings of unconsolidated affiliates |
� |
4.2 |
� |
� |
� |
4.2 |
� |
� |
� |
0.06 |
� | ||||
|
Restructuring and other severance costs |
� |
1.4 |
� |
0.4 |
� |
1.0 |
� |
� |
� |
0.02 |
� | ||||
|
Non-cash charge related to divested businesses |
� |
2.9 |
� |
2.0 |
� |
0.9 |
� |
� |
� |
0.01 |
� | ||||
|
Other |
� |
1.6 |
� |
0.5 |
� |
1.1 |
� |
� |
� |
0.02 |
� | ||||
|
As adjusted |
� |
$ |
60.1 |
� |
$ |
14.8 |
� |
$ |
45.3 |
� |
24.6 |
% |
$ |
0.63 |
� |
�
(a)�Calculated using weighted average diluted shares outstanding of 72,176.
�
�
Appendix Table A-6: Consolidated Reconciliation of Net Income to Adjusted EBITDA
�
|
� |
� |
Three�months�ended |
� |
Nine�months�ended |
� | ||||||||
|
� |
� |
September�30, |
� |
September�30, |
� | ||||||||
|
($�in�millions) |
� |
2014 |
� |
2013 |
� |
2014 |
� |
2013 |
� | ||||
|
Net income attributable to Rockwood Holdings,�Inc. stockholders |
� |
$ |
85.9 |
� |
$ |
1,111.2 |
� |
$ |
111.8 |
� |
$ |
1,160.1 |
� |
|
Net income (loss) attributable to noncontrolling interest |
� |
2.0 |
� |
0.1 |
� |
4.9 |
� |
(0.8 |
) | ||||
|
Net income |
� |
87.9 |
� |
1,111.3 |
� |
116.7 |
� |
1,159.3 |
� | ||||
|
Income tax provision (benefit) |
� |
39.4 |
� |
(9.0 |
) |
64.5 |
� |
0.8 |
� | ||||
|
(Income) loss from discontinued operations, net of tax |
� |
(33.5 |
) |
60.9 |
� |
(4.4 |
) |
45.1 |
� | ||||
|
Gain on sale of discontinued operations, net of tax |
� |
� |
� |
(1,163.8 |
) |
(2.1 |
) |
(1,163.8 |
) | ||||
|
Income (loss) from continuing operations before taxes |
� |
93.8 |
� |
(0.6 |
) |
174.7 |
� |
41.4 |
� | ||||
|
Interest expense, net |
� |
13.5 |
� |
21.2 |
� |
41.3 |
� |
67.9 |
� | ||||
|
Depreciation and amortization |
� |
24.6 |
� |
22.8 |
� |
75.7 |
� |
68.0 |
� | ||||
|
Restructuring and other severance costs |
� |
1.4 |
� |
4.6 |
� |
7.0 |
� |
13.2 |
� | ||||
|
Equity investment adjustments |
� |
9.5 |
� |
� |
� |
14.7 |
� |
� |
� | ||||
|
Systems/organization establishment expenses |
� |
0.7 |
� |
0.3 |
� |
2.1 |
� |
1.5 |
� | ||||
|
Acquisition and disposal costs |
� |
11.3 |
� |
2.2 |
� |
12.9 |
� |
5.7 |
� | ||||
|
Loss on early extinguishment/modification of debt |
� |
� |
� |
15.5 |
� |
� |
� |
15.5 |
� | ||||
|
Asset write-downs and other |
� |
0.4 |
� |
(0.7 |
) |
2.1 |
� |
4.0 |
� | ||||
|
Gain on previously held equity interest |
� |
� |
� |
(16.0 |
) |
� |
� |
(16.0 |
) | ||||
|
Foreign exchange (gain) loss on financing activities, net |
� |
(55.1 |
) |
31.2 |
� |
(60.9 |
) |
41.7 |
� | ||||
|
Other |
� |
0.5 |
� |
1.1 |
� |
0.5 |
� |
2.2 |
� | ||||
|
Adjusted EBITDA from continuing operations |
� |
100.6 |
� |
81.6 |
� |
270.1 |
� |
245.1 |
� | ||||
|
Discontinued operations |
� |
39.6 |
� |
76.2 |
� |
138.9 |
� |
244.3 |
� | ||||
|
Total Adjusted EBITDA |
� |
$ |
140.2 |
� |
$ |
157.8 |
� |
$ |
409.0 |
� |
$ |
489.4 |
� |
�
Appendix Table A-7: Reconciliation of Net Cash Provided by Operating Activities of Continuing Operations to Adjusted EBITDA
�
|
� |
� |
Nine�months�ended |
� | ||||
|
� |
� |
September�30, |
� | ||||
|
($�in�millions) |
� |
2014 |
� |
2013 |
� | ||
|
Net cash provided by operating activities of continuing operations |
� |
$ |
141.5 |
� |
$ |
91.8 |
� |
|
Changes in assets and liabilities, net of the effect of foreign currency translation and acquisitions |
� |
0.9 |
� |
60.5 |
� | ||
|
Current portion of income tax provision |
� |
49.1 |
� |
2.0 |
� | ||
|
Interest expense, net, excluding amortization of deferred financing costs |
� |
39.3 |
� |
64.2 |
� | ||
|
Restructuring and other severance costs |
� |
7.0 |
� |
13.2 |
� | ||
|
Equity investment adjustments |
� |
14.7 |
� |
� |
� | ||
|
Systems/organization establishment expenses |
� |
2.1 |
� |
1.5 |
� | ||
|
Acquisition and disposal costs |
� |
12.9 |
� |
5.7 |
� | ||
|
Asset write-downs and other |
� |
2.1 |
� |
4.0 |
� | ||
|
Other |
� |
0.5 |
� |
2.2 |
� | ||
|
Total Adjusted EBITDA from continuing operations |
� |
270.1 |
� |
245.1 |
� | ||
|
Discontinued operations |
� |
138.9 |
� |
244.3 |
� | ||
|
Total Adjusted EBITDA |
� |
$ |
409.0 |
� |
$ |
489.4 |
� |
�
�
Appendix Table A-8: Capital Expenditures by Segment
�
|
� |
� |
Three�months�ended |
� |
Nine�months�ended |
� | ||||||||
|
� |
� |
September�30, |
� |
September�30, |
� | ||||||||
|
($�in�millions) |
� |
2014 |
� |
2013 |
� |
2014 |
� |
2013 |
� | ||||
|
Lithium |
� |
$ |
39.4 |
� |
$ |
39.1 |
� |
$ |
115.0 |
� |
$ |
111.7 |
� |
|
Surface Treatment |
� |
6.2 |
� |
5.8 |
� |
18.5 |
� |
15.5 |
� | ||||
|
Other |
� |
0.2 |
� |
0.9 |
� |
0.9 |
� |
1.5 |
� | ||||
|
Capital expenditures |
� |
45.8 |
� |
45.8 |
� |
$ |
134.4 |
� |
$ |
128.7 |
� | ||
�
Appendix Table A-9: Segment Net Sales and Adjusted EBITDA
�
|
� |
� |
Three�Months�Ended |
� |
� |
� |
� |
� |
Constant |
� |
Constant�Currency�Basis |
� | |||||||||
|
� |
� |
September�30, |
� |
Total |
� |
Total |
� |
Currency |
� |
Net |
� |
Net |
� | |||||||
|
($�in�millions) |
� |
2014 |
� |
2013 |
� |
Change�in�$ |
� |
Change�in�% |
� |
Effect�in�$�(a) |
� |
Change�in�$ |
� |
Change�in�% |
� | |||||
|
Net Sales: |
� |
� |
� |
� |
� |
� |
� |
� |
� |
� |
� |
� |
� |
� |
� | |||||
|
Lithium |
� |
$ |
117.2 |
� |
$ |
120.3 |
� |
$ |
(3.1 |
) |
(2.6 |
)% |
$ |
(0.6 |
) |
$ |
(2.5 |
) |
(2.1 |
)% |
|
Surface Treatment |
� |
236.3 |
� |
222.3 |
� |
14.0 |
� |
6.3 |
� |
(0.9 |
) |
14.9 |
� |
6.7 |
� | |||||
|
Other (b) |
� |
2.8 |
� |
3.2 |
� |
(0.4 |
) |
(12.5 |
) |
� |
� |
(0.4 |
) |
(12.5 |
) | |||||
|
Net Sales |
� |
356.3 |
� |
345.8 |
� |
10.5 |
� |
3.0 |
� |
(1.5 |
) |
12.0 |
� |
3.5 |
� | |||||
|
Discontinued operations |
� |
395.1 |
� |
544.3 |
� |
(149.2 |
) |
(27.4 |
) |
1.0 |
� |
(150.2 |
) |
(27.6 |
) | |||||
|
Net Sales (including discontinued operations) |
� |
$ |
751.4 |
� |
$ |
890.1 |
� |
$ |
(138.7 |
) |
(15.6 |
)% |
$ |
(0.5 |
) |
$ |
(138.2 |
) |
(15.5 |
)% |
�
|
� |
� |
Three�Months�Ended |
� |
� |
� |
� |
� |
Constant |
� |
Constant�Currency�Basis |
� | |||||||||
|
� |
� |
September�30, |
� |
Total |
� |
Total |
� |
Currency |
� |
Net |
� |
Net |
� | |||||||
|
($�in�millions) |
� |
2014 |
� |
2013 |
� |
Change�in�$ |
� |
Change�in�% |
� |
Effect�in�$�(a) |
� |
Change�in�$ |
� |
Change�in�% |
� | |||||
|
Adjusted EBITDA: |
� |
� |
� |
� |
� |
� |
� |
� |
� |
� |
� |
� |
� |
� |
� | |||||
|
Lithium |
� |
$ |
53.9 |
� |
$ |
43.1 |
� |
$ |
10.8 |
� |
25.1 |
% |
$ |
� |
� |
$ |
10.8 |
� |
25.1 |
% |
|
Surface Treatment |
� |
57.8 |
� |
50.9 |
� |
6.9 |
� |
13.6 |
� |
(0.1 |
) |
7.0 |
� |
13.8 |
� | |||||
|
Other (b) |
� |
(11.1 |
) |
(12.4 |
) |
1.3 |
� |
10.5 |
� |
� |
� |
1.3 |
� |
10.5 |
� | |||||
|
Adjusted EBITDA from continuing operations |
� |
100.6 |
� |
81.6 |
� |
19.0 |
� |
23.3 |
� |
(0.1 |
) |
19.1 |
� |
23.4 |
� | |||||
|
Discontinued operations |
� |
39.6 |
� |
76.2 |
� |
(36.6 |
) |
(48.0 |
) |
0.8 |
� |
(37.4 |
) |
(49.1 |
) | |||||
|
Total Adjusted EBITDA (c) |
� |
$ |
140.2 |
� |
$ |
157.8 |
� |
$ |
(17.6 |
) |
(11.2 |
)% |
$ |
0.7 |
� |
$ |
(18.3 |
) |
(11.6 |
)% |
�
|
� |
� |
Nine�Months�Ended |
� |
� |
� |
� |
� |
Constant |
� |
Constant�Currency�Basis |
� | |||||||||
|
� |
� |
September�30, |
� |
Total |
� |
Total |
� |
Currency |
� |
Net |
� |
Net |
� | |||||||
|
($�in�millions) |
� |
2014 |
� |
2013 |
� |
Change�in�$ |
� |
Change�in�% |
� |
Effect�in�$�(a) |
� |
Change�in�$ |
� |
Change�in�% |
� | |||||
|
Net Sales: |
� |
� |
� |
� |
� |
� |
� |
� |
� |
� |
� |
� |
� |
� |
� | |||||
|
Lithium |
� |
$ |
349.7 |
� |
$ |
364.5 |
� |
$ |
(14.8 |
) |
(4.1 |
)% |
$ |
2.6 |
� |
$ |
(17.4 |
) |
(4.8 |
)% |
|
Surface Treatment |
� |
714.2 |
� |
656.1 |
� |
58.1 |
� |
8.9 |
� |
(0.2 |
) |
58.3 |
� |
8.9 |
� | |||||
|
Other (b) |
� |
9.2 |
� |
10.2 |
� |
(1.0 |
) |
(9.8 |
) |
0.2 |
� |
(1.2 |
) |
(11.8 |
) | |||||
|
Net Sales |
� |
1,073.1 |
� |
1,030.8 |
� |
42.3 |
� |
4.1 |
� |
2.6 |
� |
39.7 |
� |
3.9 |
� | |||||
|
Discontinued operations |
� |
1,224.4 |
� |
1,766.2 |
� |
(541.8 |
) |
(30.7 |
) |
30.3 |
� |
(572.1 |
) |
(32.4 |
) | |||||
|
Net Sales (including discontinued operations) |
� |
$ |
2,297.5 |
� |
$ |
2,797.0 |
� |
$ |
(499.5 |
) |
(17.9 |
)% |
$ |
32.9 |
� |
$ |
(532.4 |
) |
(19.0 |
)% |
�
|
� |
� |
Nine�Months�Ended |
� |
� |
� |
� |
� |
Constant |
� |
Constant�Currency�Basis |
� | |||||||||
|
� |
� |
September�30, |
� |
Total |
� |
Total |
� |
Currency |
� |
Net |
� |
Net |
� | |||||||
|
($�in�millions) |
� |
2014 |
� |
2013 |
� |
Change�in�$ |
� |
Change�in�% |
� |
Effect�in�$�(a) |
� |
Change�in�$ |
� |
Change�in�% |
� | |||||
|
Adjusted EBITDA: |
� |
� |
� |
� |
� |
� |
� |
� |
� |
� |
� |
� |
� |
� |
� | |||||
|
Lithium |
� |
$ |
139.8 |
� |
$ |
139.0 |
� |
$ |
0.8 |
� |
0.6 |
% |
$ |
1.4 |
� |
$ |
(0.6 |
) |
(0.4 |
)% |
|
Surface Treatment |
� |
167.5 |
� |
145.0 |
� |
22.5 |
� |
15.5 |
� |
0.3 |
� |
22.2 |
� |
15.3 |
� | |||||
|
Other (b) |
� |
(37.2 |
) |
(38.9 |
) |
1.7 |
� |
4.4 |
� |
(0.2 |
) |
1.9 |
� |
4.9 |
� | |||||
|
Adjusted EBITDA from continuing operations |
� |
270.1 |
� |
245.1 |
� |
25.0 |
� |
10.2 |
� |
1.5 |
� |
23.5 |
� |
9.6 |
� | |||||
|
Discontinued operations |
� |
138.9 |
� |
244.3 |
� |
(105.4 |
) |
(43.1 |
) |
4.5 |
� |
(109.9 |
) |
(45.0 |
) | |||||
|
Total Adjusted EBITDA (c) |
� |
$ |
409.0 |
� |
$ |
489.4 |
� |
$ |
(80.4 |
) |
(16.4 |
)% |
$ |
6.0 |
� |
$ |
(86.4 |
) |
(17.7 |
)% |
�
(a)�The constant currency effect is the translation impact of the change in the average rate of exchange of another currency to the U.S. dollar for the applicable period as compared to the preceding period. The impact primarily relates to the conversion of the Euro to the U.S. dollar. For the three months ended September�30, 2014 and 2013, the average rate of exchange of the Euro to the U.S. dollar is $1.32 and $1.33, respectively, and for the nine months ended September�30, 2014 and 2013, the average rate of exchange of the Euro to the U.S. dollar is $1.36 and $1.32, respectively.
�
(b)�Other includes the results of operations of the wafer reclaim business, as well as the costs of operating the Company�s corporate offices.
�
(c)�Includes the Company�s equity in Adjusted EBITDA of unconsolidated affiliates, including the acquisition of a 49% interest in the Talison Lithium joint venture and other joint ventures for Surface Treatment.
�
# # #
�
Exhibit 99.2
�
|
|
�November 5, 2014 Third Quarter 2014 Results |

�
|
|
Forward Looking Statements This press release contains, and management may make, certain "forward-looking statements" within the meaning of the Private Securities Litigation Reform Act of 1995. All statements other than statements of historical facts may be forward-looking statements. Words such as "may,� �will,� �should,� �could,� �likely,� �anticipates," �intends,� "believes," "estimates," "expects," "forecasts," �plans,� �projects,� "predicts" and �outlook� and similar words and expressions are intended to identify forward-looking statements. Examples of our forward-looking statements include, among others, statements relating to our outlook, our future operating results on a segment basis, growth prospects, our future Adjusted EBITDA and free cash flows, our share repurchase plans, our use of cash and our strategic initiatives. Although they reflect Rockwood�s current expectations, they involve a number of known and unknown risks, uncertainties and other factors that could cause actual results to differ materially from those expressed or implied, and are not guarantees of future performance. These risks, uncertainties and other factors include, without limitation, completion of the announced transaction with Albemarle Corporation (�Albemarle�); Rockwood�s business strategy; the prospects of and our outlook for our businesses; changes in general economic conditions in Europe and North America and in other locations in which Rockwood currently does business; competitive pricing or product development activities affecting demand for Rockwood�s products; technological changes affecting production of Rockwood�s materials; fluctuations in interest rates, exchange rates and currency values; availability and pricing of raw materials; governmental and environmental regulations and changes in those regulations; fluctuations in energy prices; changes in the end-use markets in which Rockwood�s products are sold; hazards associated with chemicals manufacturing; Rockwood�s ability to access capital markets; Rockwood�s high level of indebtedness; risks associated with negotiating, consummating and integrating acquisitions; risks associated with competition and the introduction of new competing products, especially from the Asia-Pacific region; risks associated with international sales and operations; risks associated with information security and the risks, uncertainties and other factors discussed under "Risk Factors" and �Management�s Discussion and Analysis of Financial Condition and Results of Operations� in Rockwood's periodic reports filed with or furnished to the Securities and Exchange Commission. |

�
|
|
Forward Looking Statements (continued) This press release also contains certain forward-looking statements with respect to the financial condition, results of operations and business of Albemarle, Rockwood and the combined businesses of Albemarle and Rockwood and with respect to the transaction and the anticipated consequences and benefits of the transaction, the targeted close date for the transaction, product development, changes in productivity, market trends, price, expected growth and earnings, cash flow generation, costs and cost synergies, portfolio diversification, economic trends and outlook. Such statements involve known and unknown risks, uncertainties, and other factors which may cause the actual results, performance, or achievements of Albemarle or Rockwood to be materially different from future results, performance or achievements expressed or implied by such forward-looking statements. Such factors include, without limitation: the receipt and timing of necessary regulatory approvals; the ability to finance the transaction; the ability to successfully operate and integrate Rockwood�s operations and realize estimated synergies; changes in economic and business conditions; changes in financial and operating performance of major customers and industries and markets served by Albemarle or Rockwood; the timing of orders received from customers; the gain or loss of significant customers; competition from other manufacturers; changes in the demand for products; limitations or prohibitions on the manufacture and sale of products; availability of raw materials; changes in the cost of raw materials and energy; changes in markets in general; changes in laws and government regulation impacting operations or products; the occurrence of claims or litigation; the occurrence of natural disasters; political unrest affecting the global economy; political instability affecting manufacturing operations or joint ventures; changes in accounting standards; changes in the jurisdictional mix of the earnings of Albemarle or Rockwood and changes in tax laws and rates; volatility and substantial uncertainties in the debt and equity markets; technology or intellectual property infringement; and decisions that Albemarle or Rockwood may make in the future. In addition, certain factors that could cause actual results to differ materially from these forward-looking statements are listed from time to time in Albemarle�s SEC reports, including, but not limited to, in the section entitled �Item 1A. Risk Factors� in the Annual Report on Form 10-K filed by Albemarle with the SEC on February 25, 2014. These forward-looking statements speak only as of the date of this press release. Rockwood expressly disclaims any obligation or undertaking to disseminate any updates or revisions to any forward-looking statement contained herein to reflect any change in its expectations with regard thereto or any change in events, conditions or circumstances on which any such statement is based. |

�
|
|
Agenda Third Quarter 2014 Results from Continuing Operations Summary Appendices |

�
|
|
Third Quarter 2014 Results from Continuing Operations |
�
|
|
Third Quarter and YTD Summary Continuing Operations Third Quarter YTD % Change % Change ($M) , except EPS Q3 2014 Q3 2013 Total Constant Currency (c) FY 2014 FY 2013 Total Constant Currency (c) Net Sales 356.3 345.8 3.0% 3.5% 1,073.1 1,030.8 4.1% 3.9% Adjusted EBITDA (a) (b) 100.6 81.6 23.3% 23.4% 270.1 245.1 10.2% 9.6% Adj. EBITDA Margin 28.2% 23.6% 4.6 ppt 25.2% 23.8% 1.4 ppt As Reported Net Income - as reported 54.4 8.4 547.6% 110.2 40.6 171.4% EPS (Diluted) - as reported (d) 0.75 0.11 581.8% 1.50 0.52 188.5% As Adjusted Net Income - as adjusted (a) 45.3 29.9 51.5% 123.0 83.3 47.7% EPS (Diluted) - as adjusted (a)(d) 0.63 0.39 61.5% 1.67 1.06 57.5% (a) See Appendices for reconciliation of non-GAAP measures. (b) Includes the Company�s equity in Adjusted EBITDA of unconsolidated affiliates, including the 49% interest in the joint venture related to Talison in Lithium and other joint ventures in Surface Treatment. (c) Based on constant currencies. See Appendices. (d) Q3 2014 based on share count of 72,176; Q3 2013 based on share count of 75,906. For YTD, Yr 2014 based on share count of 73,547; Yr 2013 based on share count of 78,264. |
�
|
|
Results By Segment � Third Quarter See Appendices for reconciliation of non-GAAP measures. Includes the Company�s equity in Adjusted EBITDA of unconsolidated affiliates, including the 49% interest in the Talison joint venture in Lithium and other joint ventures in Surface Treatment. Based on constant currencies. See Appendices. In the second quarter of 2014, Rockwood reorganized its Metal Sulfides business and began reporting it within the Surface Treatment segment. The financial statements have been reclassified for all periods presented. Net Sales Adj. EBITDA (a) (b) % Change % Change ($M) Q3 2014 Q3 2013 Total Constant Currency (c) Q3 2014 % Sales Q3 2013 % Sales Total Constant Currency (c) Lithium 117.2 120.3 (2.6%) (2.1%) 53.9 46.0% 43.1 35.8% 25.1% 25.1% Surface Treatment (d) 236.3 222.3 6.3% 6.7% 57.8 24.5% 50.9 22.9% 13.6% 13.8% Other 2.8 3.2 (12.5%) (12.5%) (11.1) (12.4) 10.5% 10.5% Total Rockwood - Continuing Operations $356.3 $345.8 3.0% 3.5% $100.6 28.2% $81.6 23.6% 23.3% 23.4% |
�
|
|
Lithium Third Quarter Net sales decreased primarily from organometallic products, driven mostly by butyllithium from reduced sales volumes attributable to weaker pricing fundamentals in the Asian market. This was largely offset by higher volumes of battery applications. Adjusted EBITDA increased primarily from the contribution of $11.2 million from our 49% ownership interest in the Talison Lithium joint venture that was completed in May 2014, partially offset by lower net sales. Net sales do not include Talison Lithium�s sales. See Appendices for reconciliation of non-GAAP measures and potash sales. Includes the Company�s equity in Adjusted EBITDA of unconsolidated affiliates, including the 49% interest in the Talison Lithium joint venture. Based on constant currencies. See Appendices. Net Sales (a) Adj. EBITDA (b) (c) % Change % Change ($M) 2014 2013 Total Constant Currency (d) 2014 2013 Total Constant Currency (d) Third Quarter Lithium Excl. Talison 117.2 120.3 (2.6%) (2.1%) 42.7 43.1 Talison - - 11.2 - Total Lithium 117.2 120.3 (2.6%) (2.1%) 53.9 43.1 25.1% 25.1% Adj. EBITDA Margin - Excl. Talison 36.4% 35.8% 0.6 ppt Adj. EBITDA Margin - Total 46.0% 35.8% 10.2 ppt YTD Lithium Excl. Talison 349.7 364.5 (4.1%) (4.8%) 125.7 139.0 Talison - - 14.1 - Total Lithium 349.7 364.5 (4.1%) (4.8%) 139.8 139.0 0.6% (0.4%) Adj. EBITDA Margin - Excl. Talison 35.9% 38.1% (2.2) ppt Adj. EBITDA Margin - Total 40.0% 38.1% 1.9 ppt 2014 2013 $�Change % Change Lithium Excl. Potash Third Quarter 107.4 114.6 (7.2) (6.3%) YTD 328.5 337.1 (8.6) (2.6%) Net Sales (a) |
�
|
|
Surface Treatment Third Quarter Net sales increased primarily due to increased volumes in most markets, particularly driven by higher automotive OEM and automotive components, aerospace, general industry and coil and cold forming applications; and, to a lesser extent, higher selling prices. Adjusted EBITDA increased primarily from higher net sales, partially offset by higher selling, general and administrative costs. Note: In the second quarter of 2014, Rockwood reorganized its Metal Sulfides business and began reporting it within the Surface Treatment segment. The financial statements have been reclassified for all periods presented. See Appendices for reconciliation of non-GAAP measures. Includes the Company�s equity in Adjusted EBITDA of unconsolidated affiliates. Based on constant currencies. See Appendices. Net Sales Adj. EBITDA (a) (b) % Change % Change ($M) 2014 2013 Total Constant Currency (c) 2014 2013 Total Constant Currency (c) Third Quarter 236.3 222.3 6.3% 6.7% 57.8 50.9 13.6% 13.8% Adj. EBITDA Margin 24.4% 22.9% 1.5 ppt YTD 714.2 656.1 8.9% 8.9% 167.5 145.0 15.5% 15.3% Adj. EBITDA Margin 23.5% 22.1% 1.4 ppt |

�
|
|
Income Statement - Reported ($M) Third Quarter YTD 2014 2013 2014 2013 Net sales $356.3 $345.8 $1,073.1 $1,030.8 Gross profit 162.9 152.7 487.8 463.3 Gross Profit % 45.7% 44.2% 45.5% 44.9% Selling, general and administrative expenses 113.8 99.8 333.3 303.0 SG&A % 31.9% 28.9% 31.1% 29.4% Operating Income 52.4 67.3 155.3 166.5 Operating income % 14.7% 19.5% 14.5% 16.2% Interest expense, net (13.5) (21.2) (41.3) (67.9) Loss on early extinguishment/modification of debt - (15.5) - (15.5) Foreign exchange gain (loss) on financing activities, net 55.1 (31.2) 60.9 (41.7) Other, net (0.2) - (0.2) - Income (loss) from continuing operations before taxes $93.8 $(0.6) $174.7 $41.4 Income tax provision (benefit) 39.4 (9.0) 64.5 0.8 Income from continuing operations $54.4 $8.4 $110.2 $40.6 Income (loss) from discontinued operations, net of tax (a) 33.5 (60.9) 4.4 (45.1) Gain on sale of discontinued operations, net of tax - 1,163.8 2.1 1,163.8 Net income $87.9 $1,111.3 $116.7 $1,159.3 Net (income) loss attributable to noncontrolling interest - discontinued operations (2.0) (0.1) (4.9) 0.8 Net income attributable to Rockwood Holdings, Inc. stockholders $85.9 $1,111.2 $111.8 $1,160.1 Amounts attributable to Rockwood Holdings, Inc. stockholders: Income from continuing operations 54.4 8.4 110.2 40.6 Income from discontinued operations 31.5 1,102.8 1.6 1,119.5 Net income $85.9 $1,111.2 $111.8 $1,160.1 (a) Includes the expected loss on sale of the TiO2 Pigments and Other Businesses, which represents the difference between the carrying value of these businesses and the expected proceeds. This carrying value includes the assumed recognition of actuarial (pension-related) losses and unrealized foreign exchange losses currently recorded in accumulated other comprehensive income within stockholders� equity, which must be recognized upon completion of the sale. |
�
|
|
Reconciliation of Net Income to Adjusted EBITDA ($M) 2014 2013 2014 2013 Net income attributable to Rockwood Holdings, Inc. stockholders $85.9 $1,111.2 $111.8 $1,160.1 Net income (loss) attributable to non-controlling interest 2.0 0.1 4.9 (0.8) Net income 87.9 1,111.3 116.7 1,159.3 Income tax provision (benefit) 39.4 (9.0) 64.5 0.8 (Income) loss from discontinued operations, net of tax (33.5) 60.9 (4.4) 45.1 Gain on sale of discontinued operations, net of tax - (1,163.8) (2.1) (1,163.8) Income (loss) from continuing operations before taxes 93.8 (0.6) 174.7 41.4 Interest expense, net 13.5 21.2 41.3 67.9 Depreciation and amortization 24.6 22.8 75.7 68.0 Sub-Total 131.9 43.4 291.7 177.3 Restructuring and other severance costs 1.4 4.6 7.0 13.2 Equity investment adjustments (a) 9.5 - 14.7 - Systems/organization establishment expenses 0.7 0.3 2.1 1.5 Acquisition and disposal costs 11.3 2.2 12.9 5.7 Loss on early extinguishment/modification of debt - 15.5 - 15.5 Asset write-downs and other 0.4 (0.7) 2.1 4.0 Gain on previously held equity interest - (16.0) - (16.0) Foreign exchange (gain) loss on financing activities, net (55.1) 31.2 (60.9) 41.7 Other 0.5 1.1 0.5 2.2 Adjusted EBITDA from continuing operations $100.6 $81.6 $270.1 $245.1 Discontinued Operations 39.6 76.2 138.9 244.3 Total Adjusted EBITDA $140.2 $157.8 $409.0 $489.4 YTD Third Quarter (a) This represents the adjustments to the EBITDA of unconsolidated affiliates included in the calculation of Adjusted EBITDA, consistent with the adjustments made on a consolidated basis (primarily for Talison Lithium and the Surface Treatment joint ventures in China). |
�
|
|
Reconciliation of Net Income/EPS as Reported to Net Income/EPS as Adjusted Net Income ($M) Diluted EPS Net Income ($M) Diluted EPS As reported - continuing operations $54.4 $0.75 $110.2 $1.50 Adjustments from continuing operations: Foreign exchange gain on financing activities, net (33.3) (0.46) (37.3) (0.51) Tax on foreign exchange gain (a) - - 12.8 0.17 Acquisition and disposal costs 9.5 0.13 10.4 0.14 Impact of other tax related items 7.5 0.10 4.9 0.07 Adjustments - equity in earnings of unconsolidated affiliates (b) 4.2 0.06 6.3 0.09 Restructuring and other severance costs 1.0 0.02 6.0 0.08 Non-cash charge related to divested businesses 0.9 0.01 6.4 0.09 Other 1.1 0.02 3.3 0.04 Net charges from continuing operations (9.1) (0.12) 12.8 0.17 As adjusted - continuing operations $45.3 $0.63 $123.0 $1.67 Weighted average number of diluted shares outstanding (in thousands) 72,176 73,547 (b) Primarily represents acquisition method inventory charges from our 49% equity interest in Talison Lithium. (a) Relates to the impact of a tax provision recorded on foreign exchange gains incurred in connection with the repayment of intercompany loans that were formerly deemed to be of a long-term nature. The tax effects of the adjustments are provisions of $24.7 million and $33.7 million for the three and nine months ended September 30, 2014, respectively, based on the statutory tax rate in the various tax jurisdictions in which the adjustments occurred, adjusted for the impact of certain valuation allowances. Third Quarter 2014 YTD 2014 |

�
|
|
Summary |

�
|
|
2014 Strategic Initiatives: Deliver Shareholder Value and Drive Growth Initiatives Progress Update Launch new $500 million share repurchase program Repurchased nearly 3.0 million shares for average price of $72.20/ps (~$215mm) in the first half of 2014* Estimated dividend yield in range of 2.8% to 3.2% Declared $0.45/ps in February, May and August 2014 Complete acquisition of 49% interest in Talison Completed the acquisition of 49% interest in Talison in May 2014 for $512.1 million Close on sale of Tio2 and four other non-strategic businesses to Huntsman Close completed on October 1, 2014 for net proceeds of approximately $950 million, subject to potential post closing adjustments Deliver on target Adjusted EBITDA margins On target for both Lithium and Surface Treatment segments Allocate excess cash on hand for accretive investments On July 15, announced merger with Albemarle, creating a premier global specialty chemicals company; expected to close in Q1 2015 * Share repurchase program terminated in July 2014 as a result of the announced merger with Albemarle. |
�
|
|
Appendices |

�
|
|
Net Sales Growth � Continuing Operations Note: Above includes Lithium, Surface Treatment and Other only. Third Quarter YTD ($M) Net Sales % Change ($M) Net Sales % Change 2014 Q3 356.3 YTD 2014 1,073.1 2013 Q3 345.8 YTD 2013 1,030.8 Change 10.5 3.0% Change 42.3 4.1% Due to (Approx.): Due to (Approx.): Pricing 1.9 0.4% Pricing 10.3 1.0% Currency (1.5) (0.4%) Currency 2.6 0.3% Volume/Mix 10.1 2.9% Volume/Mix 29.4 2.9% |

�
|
|
Results By Segment � YTD See Appendices for reconciliation of non-GAAP measures. Includes the Company�s equity in Adjusted EBITDA of unconsolidated affiliates, including the 49% interest in the joint venture related to Talison in Lithium and other joint ventures in Surface Treatment. Based on constant currencies. See Appendices. In the second quarter of 2014, Rockwood reorganized its Metal Sulfides business and began reporting it within the Surface Treatment segment. The financial statements have been reclassified for all periods presented. Net Sales Adj. EBITDA (a) (b) % Change % Change ($M) YTD 2014 YTD 2013 Total Constant Currency (c) YTD 2014 % Sales YTD 2013 % Sales Total Constant Currency (c) Lithium 349.7 364.5 (4.1%) (4.8%) 139.8 40.0% 139.0 38.1% 0.6% (0.4%) Surface Treatment (d) 714.2 656.1 8.9% 8.9% 167.5 23.5% 145.0 22.1% 15.5% 15.3% Other 9.2 10.2 (9.8%) (11.8%) (37.2) (38.9) 4.4% 4.9% Total Rockwood - Continuing Operations $1,073.1 $1,030.8 4.1% 3.9% $270.1 25.2% $245.1 23.8% 10.2% 9.6% |
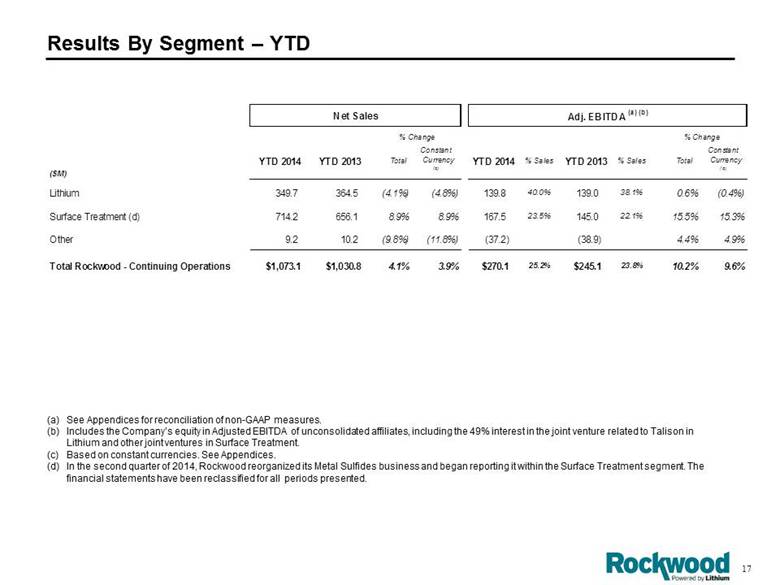
�
|
|
Reconciliation of Net Income to Adjusted EBITDA ($M) 2014 2013 2014 2013 Net income attributable to Rockwood Holdings, Inc. stockholders $85.9 $1,111.2 $111.8 $1,160.1 Net income (loss) attributable to non-controlling interest 2.0 0.1 4.9 (0.8) Net income 87.9 1,111.3 116.7 1,159.3 Income tax provision (benefit) 39.4 (9.0) 64.5 0.8 (Income) loss from discontinued operations, net of tax (33.5) 60.9 (4.4) 45.1 Gain on sale of discontinued operations, net of tax - (1,163.8) (2.1) (1,163.8) Income (loss) from continuing operations before taxes 93.8 (0.6) 174.7 41.4 Interest expense, net 13.5 21.2 41.3 67.9 Depreciation and amortization 24.6 22.8 75.7 68.0 Restructuring and other severance costs 1.4 4.6 7.0 13.2 Equity investment adjustments (a) 9.5 - 14.7 - Systems/organization establishment expenses 0.7 0.3 2.1 1.5 Acquisition and disposal costs 11.3 2.2 12.9 5.7 Loss on early extinguishment/modification of debt - 15.5 - 15.5 Asset write-downs and other 0.4 (0.7) 2.1 4.0 Gain on previously held equity interest - (16.0) - (16.0) Foreign exchange (gain) loss on financing activities, net (55.1) 31.2 (60.9) 41.7 Other 0.5 1.1 0.5 2.2 Adjusted EBITDA from continuing operations $100.6 $81.6 $270.1 $245.1 Discontinued Operations 39.6 76.2 138.9 244.3 Total Adjusted EBITDA $140.2 $157.8 $409.0 $489.4 Third Quarter YTD 2014 2014 Equity in earnings of unconsolidated affiliates 5.1 9.9 Interest income, net (0.4) (0.7) Depreciation and amortization 2.1 2.8 Income tax provision 1.7 3.6 Acquisition method inventory charges 6.2 8.9 Other (0.1) 0.1 Total Adjustments 9.5 14.7 Adjusted EBITDA of unconsolidated affiliates $14.6 $24.6 (a) This represents the adjustments to the EBITDA of unconsolidated affiliates included in the calculation of Adjusted EBITDA, consistent with the adjustments made on a consolidated basis: YTD Third Quarter |
�
|
|
Reconciliation of Pre-Tax Income to Adjusted EBITDA � Third Quarter ($M) Third Quarter 2014 Lithium Surface Treatment Other Discontinued Operations Consolidated Income - cont. ops. before taxes $33.7 $42.5 $17.6 $93.8 Interest (income) expense, net (0.4) 2.9 11.0 13.5 Depreciation and amortization 11.1 8.7 4.8 24.6 Restructuring and other severance costs 0.1 1.3 - 1.4 Equity investment adjustments 8.7 0.8 - 9.5 Systems/organization establishment expenses 0.6 - 0.1 0.7 Acquisition and disposal costs 0.1 0.2 11.0 11.3 Asset write-downs and other 0.2 0.3 (0.1) 0.4 Foreign exchange (gain) loss on financing activities, net (0.2) 0.7 (55.6) (55.1) Other - 0.4 0.1 0.5 Adjusted EBITDA - continuing operations $53.9 $57.8 $(11.1) - $100.6 Discontinued Operations - - - 39.6 39.6 Total Adjusted EBITDA $53.9 $57.8 $(11.1) $39.6 $140.2 Third Quarter 2013 Income (loss) - cont. ops. before taxes $27.6 $48.3 $(76.5) $(0.6) Interest expense, net 0.5 2.9 17.8 21.2 Depreciation and amortization 11.6 8.8 2.4 22.8 Restructuring and other severance costs 1.4 1.0 2.2 4.6 Systems/organization establishment expenses 0.2 0.1 - 0.3 Acquisition and disposal costs - 0.7 1.5 2.2 Loss on early extinguishment/modifications of debt 2.2 3.2 10.1 15.5 Asset write-downs and other (0.8) 0.1 - (0.7) Gain on previously held equity investment - (16.0) - (16.0) Foreign exchange loss on financing activities, net 0.4 1.3 29.5 31.2 Other - 0.5 0.6 1.1 Adjusted EBITDA - continuing operations $43.1 $50.9 $(12.4) - $81.6 Discontinued Operations - - - 76.2 76.2 Total Adjusted EBITDA $43.1 $50.9 $(12.4) $76.2 $157.8 |

�
|
|
Reconciliation of Pre-Tax Income to Adjusted EBITDA � YTD ($M) YTD 2014 Lithium Surface Treatment Other Discontinued Operations Consolidated Income (loss) - cont. ops. before taxes $92.2 $122.8 $(40.3) $174.7 Interest (income) expense, net (0.9) 9.0 33.2 41.3 Depreciation and amortization 34.7 26.2 14.8 75.7 Restructuring and other severance costs 3.7 3.3 - 7.0 Equity investment adjustments 11.8 2.9 - 14.7 Systems/organization establishment expenses 1.7 0.3 0.1 2.1 Acquisition and disposal costs 0.1 0.9 11.9 12.9 Asset write-downs and other 1.8 0.2 0.1 2.1 Foreign exchange (gain) loss on financing activities, net (5.3) 1.5 (57.1) (60.9) Other - 0.4 0.1 0.5 Adjusted EBITDA - continuing operations $139.8 $167.5 $(37.2) - $270.1 Discontinued Operations - - - 138.9 138.9 Total Adjusted EBITDA $139.8 $167.5 $(37.2) $138.9 $409.0 YTD 2013 Income (loss) - cont. ops. before taxes $87.2 $114.8 $(160.6) $41.4 Interest expense, net 1.9 9.0 57.0 67.9 Depreciation and amortization 34.5 26.2 7.3 68.0 Restructuring and other severance costs 5.8 4.4 3.0 13.2 Systems/organization establishment expenses 0.7 0.8 - 1.5 Acquisition and disposal costs 0.1 1.5 4.1 5.7 Loss on early extinguishment/modifications of debt 2.2 3.2 10.1 15.5 Asset write-downs and other 3.9 0.1 - 4.0 Gain on previously held equity investment - (16.0) - (16.0) Foreign exchange loss (gain) on financing activities, net 2.7 - 39.0 41.7 Other - 1.0 1.2 2.2 Adjusted EBITDA - continuing operations $139.0 $145.0 $(38.9) - $245.1 Discontinued Operations - - - 244.3 244.3 Total Adjusted EBITDA $139.0 $145.0 $(38.9) $244.3 $489.4 |

�
|
|
Constant Currency Effect on Results � Third Quarter ($M) Constant Currency basis Net Change in $�Net Change in Net Sales Lithium $(3.1) (2.6) % $(0.6) $(2.5) (2.1) % Surface Treatment 14.0 6.3 (0.9) 14.9 6.7 Other (0.4) (12.5) - (0.4) (12.5) Net Sales from Continuing Operations $10.5 3.0 % $(1.5) $12.0 3.5 % Discontinued operations (149.2) (27.4) 1.0 (150.2) (27.6) Total Net Sales $(138.7) (15.6) % $(0.5) $(138.2) (15.5) % Adjusted EBITDA Lithium $10.8 25.1 % - $10.8 25.1 % Surface Treatment 6.9 13.6 (0.1) 7.0 13.8 Other 1.3 10.5 - 1.3 10.5 Adjusted EBITDA from Continuing Operations $19.0 23.3 % $(0.1) $19.1 23.4 % Discontinued Operations (36.6) (48.0) 0.8 (37.4) (49.1) Total Adjusted EBITDA $(17.6) (11.2) % $0.7 $(18.3) (11.6) % Change: Third Quarter 2014 versus 2013 (a) The constant currency effect is the translation impact of the change in the average rate of exchange of another currency to the U.S. dollar for the applicable period as comp ared to the preceding period. The impact primarily relates to the conversion of the Euro to the U.S. dollar. Constant Currency Effect in $�(a) Total Change in % Total Change in $�(a) (a) |

�
|
|
Constant Currency Effect on Results � YTD ($M) Constant Currency basis Net Change in $�Net Change in Net Sales Lithium $(14.8) (4.1) % $2.6 $(17.4) (4.8) % Surface Treatment 58.1 8.9 (0.2) 58.3 8.9 Other (1.0) (9.8) 0.2 (1.2) (11.8) Net Sales from Continuing Operations $42.3 4.1 % $2.6 $39.7 3.9 % Discontinued Operations (541.8) (30.7) 30.3 (572.1) (32.4) Total Net Sales $(499.5) (17.9) % $32.9 $(532.4) (19.0) % Adjusted EBITDA Lithium $0.8 0.6 % $1.4 $(0.6) (0.4) % Surface Treatment 22.5 15.5 0.3 22.2 15.3 Other 1.7 4.4 (0.2) 1.9 4.9 Adjusted EBITDA from Continuing Operations $25.0 10.2 % $1.5 $23.5 9.6 % Discontinued Operations (105.4) (43.1) 4.5 (109.9) (45.0) Total Adjusted EBITDA $(80.4) (16.4) % $6.0 $(86.4) (17.7) % Change: YTD 2014 versus 2013 (a) The constant currency effect is the translation impact of the change in the average rate of exchange of another currency to the U.S. dollar for the applicable period as compared to the preceding period. The impact primarily relates to the conversion of the Euro to the U.S. dollar. Total Change in $�Total Change in % Constant Currency Effect in $�(a) (a) (a) (a) |

�
|
|
Reconciliation of Net Income/EPS as Reported to Net Income/EPS as Adjusted Net Income ($M) Diluted EPS Net Income ($M) Diluted EPS As reported - continuing operations $8.4 $0.11 $40.6 $0.52 Adjustments from continuing operations: Foreign exchange loss on financing activities, net 20.7 0.27 28.1 0.36 Gain on previously held equity interest (16.0) (0.21) (16.0) (0.20) Loss on early extinguishment/modification of debt 10.5 0.14 10.5 0.13 Restructuring and other severance costs 3.3 0.04 9.8 0.13 Acquisition and disposal costs 1.5 0.02 4.1 0.05 Impact of other tax related items 1.1 0.01 1.1 0.01 Other 0.4 0.01 5.1 0.06 Net charges from continuing operations 21.5 0.28 42.7 0.54 As adjusted - continuing operations $29.9 $0.39 $83.3 $1.06 Weighted average number of diluted shares outstanding (in thousands) 75,906 78,264 The tax effects of the adjustments are benefits of $16.7 million and $26.4 million for the three and nine months ended September 30, 2013, based on the statutory tax rate in the various tax jurisdictions in which the adjustments occurred, adjusted for the impact of certain valuation allowances. Third Quarter 2013 YTD 2013 |

�
|
|
Tax Provision Reconciliation � Third Quarter 2014 ($M) Income from cont. ops. before taxes Income tax provision (benefit) Income from cont. ops. Effective tax rate Diluted EPS (a) As reported 93.8 $�39.4 $�54.4 $�42.0% 0.75 $�Adjustments from continuing operations: Foreign exchange gain on financing activities, net (55.1) (21.8) (33.3) (0.46) Acquisition and disposal costs 11.3 1.8 9.5 0.13 Impact of other tax related items - (7.5) 7.5 0.10 Adjustments - equity in earnings of unconsolidated affiliates 4.2 - 4.2 0.06 Restructuring and other severance costs 1.4 0.4 1.0 0.02 Non-cash charge related to divested businesses 2.9 2.0 0.9 0.01 Other 1.6 0.5 1.1 0.02 As adjusted 60.1 $�14.8 $�45.3 $�24.6% 0.63 $�Third Quarter 2014 (a) Calculated using weighted average diluted shares outstanding of 72,176. |
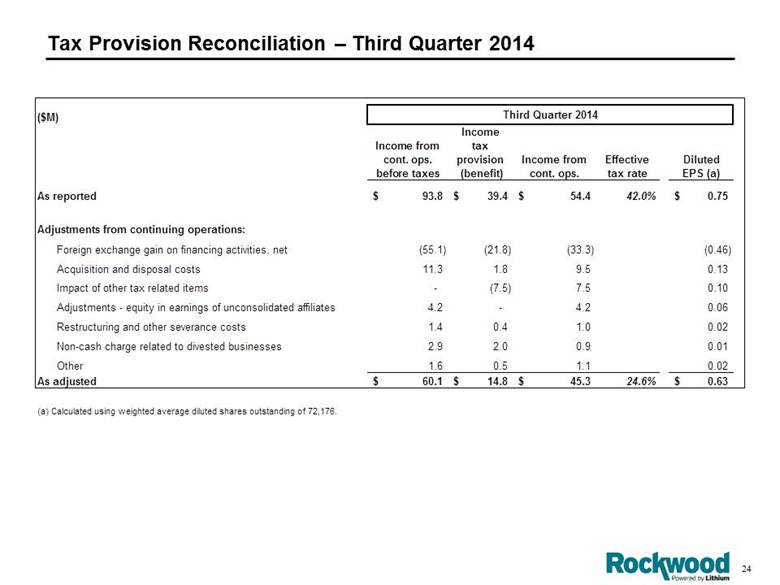
�
|
|
Tax Provision Reconciliation � YTD 2014 ($M) Income from cont. ops. before taxes Income tax provision (benefit) Income from cont. ops. Effective tax rate Diluted EPS (a) As reported 174.7 $�64.5 $�110.2 $�36.9% 1.50 $�Adjustments from continuing operations: Foreign exchange gain on financing activities, net (60.9) (23.6) (37.3) (0.51) Tax on foreign exchange gain (b) - (12.8) 12.8 0.17 Acquisition and disposal costs 12.9 2.5 10.4 0.14 Non-cash charge related to divested businesses 9.1 2.7 6.4 0.09 Adjustments - equity in earnings of unconsolidated affiliates 6.3 - 6.3 0.09 Restructuring and other severance costs 7.0 1.0 6.0 0.08 Impact of other tax related items - (4.9) 4.9 0.07 Other 4.7 1.4 3.3 0.04 As adjusted 153.8 $�30.8 $�123.0 $�20.0% 1.67 $�(b) Relates to the impact of a tax provision recorded on foreign exchange gains incurred in connection with the repayment of intercompany loans that were formerly deemed to be of a long-term nature. YTD 2014 (a) Calculated using weighted average diluted shares outstanding of 73,547. |

�
|
|
Tax Provision Reconciliation � Third Quarter 2013 ($M) Income from cont. ops. before taxes Income tax provision (benefit) Income from cont. ops. Effective tax rate Diluted EPS (a) As reported (0.6) $�(9.0) $�8.4 $�1500.0% 0.11 $�Adjustments from continuing operations: Foreign exchange loss on financing activities, net 31.2 10.5 20.7 0.27 Gain on previously held equity interest (16.0) - (16.0) (0.21) Loss on early extinguishment/modification of debt 15.5 5.0 10.5 0.14 Restructuring and other severance costs 4.6 1.3 3.3 0.04 Acquisition and disposal costs 2.2 0.7 1.5 0.02 Impact of other tax related items - (1.1) 1.1 0.01 Other 0.7 0.3 0.4 0.01 As adjusted 37.6 $�7.7 $�29.9 $�20.5% 0.39 $�Third Quarter 2013 (a) Calculated using weighted average diluted shares outstanding of 75,906. |

�
|
|
Tax Provision Reconciliation � YTD 2013 ($M) Income from cont. ops. before taxes Income tax provision (benefit) Income from cont. ops. Effective tax rate Diluted EPS (a) As reported 41.4 $�0.8 $�40.6 $�1.9% 0.52 $�Adjustments from continuing operations: Foreign exchange loss on financing activities, net 41.7 13.6 28.1 0.36 Gain on previously held equity interest (16.0) - (16.0) (0.20) Loss on early extinguishment/modification of debt 15.5 5.0 10.5 0.13 Restructuring and other severance costs 14.5 4.7 9.8 0.13 Acquisition and disposal costs 5.7 1.6 4.1 0.05 Impact of other tax related items - (1.1) 1.1 0.01 Other 7.7 2.6 5.1 0.06 As adjusted 110.5 $�27.2 $�83.3 $�24.6% 1.06 $�(a) Calculated using weighted average diluted shares outstanding of 78,264. YTD 2013 |

�
|
|
Consolidated Net Debt ($M) December 31, 2013 March 31, 2014 June 30, 2014 September 30, 2014 Total LTM Adj EBITDA - cont. ops. (a) $323.3 $326.7 $329.3 $348.3 Net Debt (b) Sr. Sub. Notes 1,250.0 1,250.0 1,249.3 1,249.3 Other Debt 45.4 44.7 43.0 39.0 Total Debt $1,295.4 $1,294.7 $1,292.3 $1,288.3 Cash (c) (1,522.8) (1,460.6) (696.3) (710.0) Net Debt -$227.4 -$165.9 $596.0 $578.3 Net Debt / LTM Adj. EBITDA -0.70 x -0.51 x 1.81 x 1.66 x Secured Debt / LTM Adj. EBITDA 0.14 x 0.13 x 0.13 x 0.11 x (a) Includes the Company�s equity in Adjusted EBITDA of unconsolidated affiliates, including the 49% interest in the joint venture related to Talison in Lithium and other joint ventures in Surface Treatment. (c) Does not include net proceeds of $950 million, before post closing adjustments, from the sale of the TiO2 and Other Businesses received on October 1, 2014. (b) All Euro denominated debt is converted at the balance sheet rate ($1.37 at Dec. 31, 2013, $1.38 at Mar. 31, 2014; $1.37 at Jun. 30, 2014 and $1.26 at Sep. 30, 2014). |
�
|
|
Net Debt / LTM Adjusted EBITDA Note: Net Debt is total debt less total cash. LTM Adjusted EBITDA is calculated as set forth in the leverage ratio under the former senior secured credit agreement and indenture governing the Senior Notes due in 2020 for Rockwood Specialties Group, Inc. Does not include proceeds from the sale of the TiO2 and Other Businesses received on October 1, 2014. |

�
|
|
Reconciliation of Net Cash to Adjusted EBITDA YTD ($M) 2014 2013 Net cash provided by operating activities - continuing operations $141.5 $91.8 Changes in assets and liabilities, net of the effect of foreign currency translation and acquisitions 0.9 60.5 Current portion of income tax provision 49.1 2.0 Interest expense, net, excluding amortization of deferred financing costs 39.3 64.2 Restructuring and other severance costs 7.0 13.2 Equity investment adjustments 14.7 - Systems/organization establishment expenses 2.1 1.5 Acquisition and disposal costs 12.9 5.7 Asset write-downs and other 2.1 4.0 Other 0.5 2.2 Adjusted EBITDA from Continuing Operations $270.1 $245.1 Discontinued Operations 138.9 244.3 Total Adjusted EBITDA $409.0 $489.4 |

�
|
|
Free Cash Flow ($M) Third Quarter 2014 YTD 2014 Total Adjusted EBITDA (a) $140.2 $409.0 WC Change (b) 6.5 (81.1) Cash Taxes (15.9) (43.5) Cash Interest (0.1) (30.4) Adjusted Cash From Operating Activities (c) $130.7 $254.0 CAPEX (88.7) (260.6) Proceeds on Sale of Assets 0.7 3.2 Free Cash Flow (d) $42.7 $(3.4) (a) (b) (c) (d) Includes the Company�s equity in Adjusted EBITDA of unconsolidated affiliates, including the 49% interest in the joint venture related to Talison in Lithium and other joint ventures in Surface Treatment. Includes changes in accounts receivable, inventories, prepaid expenses, accounts payable, income taxes payable and accrued expenses. All figures net of the effect of foreign currency translation and impact of acquisitions and divestitures. Excludes $9.4 million and $33.6 million for the three and nine months ended September 30, 2014, respectively, for the cash impact of adjustments made to EBITDA under the former senior secured credit agreement and indenture governing the Senior Notes due in 2020. Free Cash Flow excludes share repurchases of $0.5 million and $214.7 million in the three and nine months ended September 30, 2014, respectively, and dividends paid of $32.1 million and $97.6 million in the three and nine months ended September 30, 2014, respectively. |

�
|
|
Reconciliation of Net Cash to Free Cash Flow Third Quarter YTD ($M) 2014 2014 Net cash provided by operating activities $121.3 $220.4 Capital expenditures (88.7) (260.6) Acquisition and disposal costs 11.1 24.9 Restructuring charges 1.8 6.6 Excess tax benefits from stock-based payment arrangements (3.8) 1.0 Other 1.0 4.3 Free Cash Flow $42.7 $(3.4) |
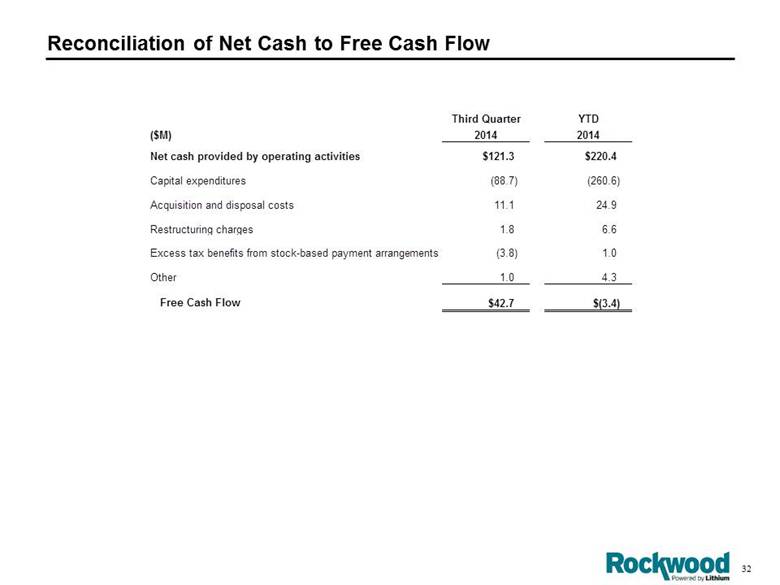
�
|
|
[LOGO] |
�