

Wyndham Destinations Reports Third Quarter 2018 Results
 Tweet
Tweet Share
ShareGet Alerts WYND Hot Sheet
Join SI Premium – FREE
ORLANDO, Fla., Nov. 1, 2018 /PRNewswire/ -- Wyndham Destinations, Inc. (NYSE: WYND), the world's largest vacation ownership and exchange company, today reported third quarter 2018 financial results for the three months ended September 30, 2018.
Results are reported in accordance with U.S. generally accepted accounting principles (GAAP) adjusting for certain items (non-GAAP). The Company is also presenting non-GAAP results on a further adjusted basis as if the spin-off of its hotel business and the sale of its European vacation rentals business had occurred for all periods presented. Full reconciliations of non-GAAP financial measures to the most directly comparable GAAP financial measures for the reported periods appear in the financial tables section of this press release. Highlights include:
- Income from continuing operations increased 28% to $131 million and diluted earnings per share (EPS) from continuing operations increased 32% to $1.31. Adjusted EBITDA increased 6% to $269 million.
- Further adjusted EBITDA increased 5% to $271 million, compared to guidance of $262 million to $272 million.
- Further adjusted diluted EPS increased 15% to $1.47, compared to guidance of $1.37 to $1.47.
- Total revenue increased 5% to $1.1 billion and gross VOI sales increased 7% to $640 million.
- Repurchased $106 million of stock in the third quarter and an additional $32 million in October.
- Revised full-year further adjusted EBITDA guidance to a range of $952 million to $960 million to reflect the impact from hurricanes Florence and Michael and stronger operating performance in the third quarter of 2018.
"Our company reported another outstanding quarter, demonstrated by strong operational results that came in above expectations," said Michael D. Brown, president and chief executive officer of Wyndham Destinations.
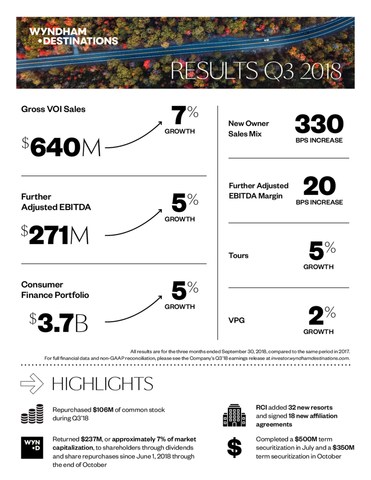
"During the third quarter, gross VOI sales increased 7%, further adjusted EBITDA increased 5% and we maintained margins while we continue to track ahead on new owner sales mix, which increased 330 basis points in the third quarter. We also meaningfully increased the pace of share buybacks in the third quarter, repurchasing $106 million in stock."
"As we have demonstrated this quarter, Wyndham Destinations continued to execute upon our key strategic initiatives, which included increasing our new owner sales mix and further integration with the Blue Thread, all while preserving our margins. Our elevated level of share repurchases in the third quarter underscored our commitment of returning value to shareholders," said Brown.
Results From Continuing Operations
In May 2018, the Company sold its European vacation rentals business and completed the spin-off of its hotel business into a separate publicly traded company. For all periods presented, the results of operations for the hotel business and the European vacation rentals business have been classified as discontinued operations.
During the third quarter of 2018, reported revenues, income from continuing operations and income from continuing operations per diluted share were $1.1 billion, $131 million and $1.31, respectively. This compared to reported revenues of $1.0 billion, income from continuing operations of $102 million and income from continuing operations per diluted share of $0.99 in the third quarter of 2017. Total third quarter 2018 adjusted EBITDA from continuing operations increased 6% to $269 million.
Company Results — Further Adjusted
Further adjusted results are presented as if Wyndham Hotels & Resorts were separated from Wyndham Destinations and the sale of the European rentals business was completed for all periods presented.
During the third quarter of 2018, further adjusted net income was $146 million and further adjusted diluted EPS was $1.47 based on 100 million diluted shares outstanding. Further adjusted EBITDA was $271 million, compared to $257 million in the third quarter of 2017, and was near the top-end of the Company's guidance range of $262 million to $272 million. Hurricane Florence was estimated to have negatively impacted further adjusted EBITDA by $10 million in the third quarter of 2018.
Business Segment Results
Vacation Ownership
$ in millions | 2018 | 2017 | % change | |||
Revenue | $820 | $768 | 7 | % | ||
Adjusted EBITDA | $203 | $194 | 5 | % | ||
Further Adjusted EBITDA | $203 | $186 | 9 | % | ||
Vacation Ownership revenues increased 7%, primarily due to a 7% increase in gross vacation ownership interest (VOI) sales of $640 million. Tours increased 5% year-over-year and Volume Per Guest (VPG) increased 2%. The mix of new owner sales increased 330 basis points over the prior year and new owner sales volume increased 15%.
Vacation Ownership further adjusted EBITDA increased 9% to $203 million, primarily due to revenue growth of 7%, consumer finance income growth and cost efficiencies in general and administrative expenses.
Consumer finance gross receivables grew 5% year-over-year to $3.7 billion. The provision for loan loss as a percentage of gross VOI sales, net of fee-for-service sales, was 20.8% at the end of the third quarter of 2018. The provision for loan loss increased to $132 million, with the $9 million year-over-year increase due to higher gross VOI sales.
Exchange & Rentals
$ in millions | 2018 | 2017 | % change | |||
Revenue | $243 | $248 | (2)% | |||
Adjusted EBITDA | $79 | $80 | (1)% | |||
Further Adjusted EBITDA | $79 | $80 | (1)% | |||
Exchange & Rentals revenues decreased 2%, primarily due to a 5% decline in exchange revenue per member. The decline in exchange revenue per member was due to lower inventory levels, a change in customer mix, economic headwinds in Latin America and Hurricane Florence.
Further adjusted EBITDA decreased $1 million, or 1%, due to lower revenue per member, offset by cost efficiencies within the business.
Balance Sheet and Liquidity
Net Debt — As of September 30, 2018, the Company's leverage ratio was 2.9x. The Company had $3.0 billion of corporate debt outstanding, which excluded $2.2 billion of non-recourse debt related to its securitized notes receivable. Additionally, the Company had cash and cash equivalents of $164 million. Refer to Table 9 for definitions of net debt and leverage ratio.
Cash Flow — For the nine months ended September 30, 2018, net cash provided by operating activities from continuing operations was $205 million, compared to $264 million in the prior year period. Free cash flow from continuing operations was $236 million for the nine months ended September 30, 2018, compared to $42 million for the same period in 2017, primarily due to securitization activity in 2018. Further adjusted free cash flow from continuing operations was $356 million and $187 million for the same periods, respectively.
Share Repurchases — During the third quarter of 2018, the Company repurchased 2.4 million shares of common stock for $106 million at a weighted average price of $43.39 per share. As of September 30, 2018, the Company had $916 million remaining in its share repurchase authorization. Subsequent to the end of the quarter, the Company repurchased another $32 million of shares in the month of October.
Dividend — The Company announced a cash dividend of $0.41 per share on July 27, 2018, which was paid on September 28, 2018 to shareholders of record as of September 14, 2018.
Securitization — On July 18, 2018, the Company closed a $500 million term securitization with a weighted average coupon of 3.65% and an advance rate of 88.7%. Subsequent to the end of the quarter, the Company closed a $350 million term securitization with a weighted average coupon of 4.02% and an advance rate of 98.0%.
Outlook
The Company is revising its further adjusted full-year 2018 guidance as follows:
- Revenues of $3.925 billion to $3.975 billion, compared to the previous expectation of $3.975 billion to $4.085 billion
- Further adjusted EBITDA of $952 million to $960 million, compared to the previous expectation of $955 million to $975 million
- Further adjusted net income of $475 million to $483 million, compared to the previous expectation of $476 million to $496 million
- Stock based compensation of $17 million to $19 million, compared to the previous expectation of $16 million to $20 million
- Further adjusted diluted EPS of $4.77 to $4.85, compared to the previous expectation of $4.74 to $4.94
The Company's guidance assumes that the spin-off of its hotel business and the sale of its European vacation rentals business had been completed on January 1, 2018. This guidance is presented only on a non-GAAP further adjusted basis because not all of the information necessary for a quantitative reconciliation of forward-looking non-GAAP financial measures to the most directly comparable GAAP financial measure is available without unreasonable effort, primarily due to uncertainties relating to the occurrence or amount of these adjustments that may arise in the future. Please refer to Table 8 for further information.
Conference Call InformationWyndham Destinations will hold a conference call with investors to discuss the Company's results and outlook today at 8:30 a.m. ET. Participants may listen to a simultaneous webcast of the conference call, which may be accessed through the Company's website at investor.wyndhamdestinations.com, or by dialing 877-876-9177, passcode WYND, approximately 10 minutes before the scheduled start time. For those unable to listen to the live broadcast, an archive of the webcast will be available on the Company's website for approximately 90 days beginning at 12:00 p.m. ET today. Additionally, a telephone replay will be available for approximately 10 days beginning at 12:00 p.m. ET today at 800-723-7372.
Presentation of Financial InformationFinancial information discussed in this press release includes non-GAAP measures, which include or exclude certain items. The Company utilizes non-GAAP measures, defined in Table 9, on a regular basis to assess performance of its reportable segments and allocate resources. These non-GAAP measures differ from reported GAAP results and are intended to illustrate what management believes are relevant period-over-period comparisons and are helpful to investors as an additional tool for further understanding and assessing the Company's ongoing operating performance. Management also internally uses these measures to assess our operating performance, both absolutely and in comparison to other companies, and in evaluating or making selected compensation decisions. Exclusion of items in the Company's non-GAAP presentation should not be considered an inference that these items are unusual, infrequent or non-recurring. The Company is also presenting non-GAAP results on a further adjusted basis as if the spin-off of its hotel business and the sale of its European vacation rentals business had occurred for all periods presented. Full reconciliations of non-GAAP financial measures to the most directly comparable GAAP financial measures for the reported periods appear in the financial tables section of the press release.
About Wyndham DestinationsWyndham Destinations (NYSE: WYND) believes in putting the world on vacation. As the world's largest vacation ownership and exchange company, Wyndham Destinations offers everyday travelers the opportunity to own, exchange or rent their vacation experience while enjoying the quality, flexibility and value that Wyndham delivers. The company's global presence in 110 countries means more vacation choices for its nearly four million members and owner families: Wyndham's 220 vacation club resorts, which offer a contemporary take on the timeshare model, with signature brands including CLUB WYNDHAM®, WorldMark® by Wyndham, Margaritaville Vacation Club® by Wyndham, and Shell Vacations Club; 4,300+ affiliated resorts through RCI, the world's leader in vacation exchange; and 10,000 rental properties from coast to coast through Wyndham Vacation Rentals, North America's largest professionally managed vacation rental business. Year after year, a worldwide team of 25,000 associates delivers exceptional vacation experiences to families around the globe as they make memories to last a lifetime. At Wyndham Destinations, our world is your destination. Learn more at wyndhamdestinations.com.
Forward-Looking StatementsThis press release contains "forward-looking statements" within the meaning of Section 27A of the Securities Act of 1933, as amended, and Section 21E of the Securities Exchange Act of 1934, as amended. Forward-looking statements include those that convey management's expectations as to the future based on plans, estimates and projections at the time Wyndham Destinations makes the statements and may be identified by words such as "will," "expect," "believe," "plan," "anticipate," "intend," "goal," "future," "outlook," "guidance," "target," "projection," "estimate" and similar words or expressions, including the negative version of such words and expressions. Forward-looking statements involve known and unknown risks, uncertainties and other factors, which may cause the actual results, performance or achievements of Wyndham Destinations to be materially different from any future results, performance or achievements expressed or implied by such forward-looking statements. The forward-looking statements contained in this press release include statements related to Wyndham Destinations' current views and expectations with respect to its future performance and operations (including the statements in the "Outlook" section of this press release). You are cautioned not to place undue reliance on these forward-looking statements, which speak only as of the date of this press release. Factors that could cause actual results to differ materially from those in the forward-looking statements include without limitation general economic conditions, the performance of the financial and credit markets, our ability to obtain financing, our credit ratings (including changes thereto as result of the spin-off and other related transactions), post-closing credit obligations as result of the sale of our European vacation rentals business, the competition in and the economic environment for the timeshare industry, the impact of war, terrorist activity or political strife, operating risks associated with the vacation ownership and vacation exchange businesses, unanticipated developments related to the impact of the spin-off on our relationships with our customers, suppliers, employees and others with whom we have relationships, uncertainties related to our ability to realize the anticipated benefits of the spin-off, as well as those factors described in our Quarterly Report on Form 10-Q, filed with the SEC on August 8, 2018, and subsequently filed Quarterly Reports on Form 10-Q and Current Reports on Form 8-K. Except as required by law, Wyndham Destinations undertakes no obligation to publicly update or revise any forward-looking statements, whether as a result of new information, subsequent events or otherwise.
Wyndham DestinationsTable of Contents
Table Number
- Condensed Consolidated Statements of Income (Unaudited)
- Summary Data Sheet
- Operating Statistics
- Revenue by Reportable Segment
- Non-GAAP Measure: Reconciliation of Net Income to Adjusted EBITDA to Further Adjusted EBITDA to Further Adjusted Net Income From Continuing Operations
- Non-GAAP Measure: Reconciliation of Gross VOI Sales
- Non-GAAP Measure: Reconciliation of Free Cash Flows and Further Adjusted Free Cash Flows
- 2018 Further Adjusted Guidance
- Definitions
Table 1 | |||||||||||||||
Wyndham DestinationsCondensed Consolidated Statements of Income (Unaudited)(in millions, except per share amounts) | |||||||||||||||
Three Month Ended September 30 | Nine Months Ended September 30 | ||||||||||||||
2018 | 2017 | 2018 | 2017 | ||||||||||||
Net revenues | |||||||||||||||
VOI sales | $ | 503 | $ | 466 | $ | 1,323 | $ | 1,262 | |||||||
Service and membership fees | 417 | 416 | 1,245 | 1,225 | |||||||||||
Consumer financing | 126 | 119 | 363 | 343 | |||||||||||
Other | 16 | 14 | 45 | 46 | |||||||||||
Net revenues | 1,062 | 1,015 | 2,976 | 2,876 | |||||||||||
Expenses | |||||||||||||||
Operating | 431 | 429 | 1,252 | 1,238 | |||||||||||
Cost of vacation ownership interests | 53 | 41 | 131 | 115 | |||||||||||
Consumer financing interest | 23 | 17 | 62 | 54 | |||||||||||
Marketing and reservation | 179 | 154 | 465 | 412 | |||||||||||
General and administrative | 116 | 131 | 402 | 439 | |||||||||||
Separation and related costs | 35 | 16 | 198 | 16 | |||||||||||
Asset impairments | (4) | — | (4) | 140 | |||||||||||
Restructuring | — | 8 | — | 14 | |||||||||||
Depreciation and amortization | 32 | 35 | 105 | 100 | |||||||||||
Total expenses | 865 | 831 | 2,611 | 2,528 | |||||||||||
Operating income | 197 | 184 | 365 | 348 | |||||||||||
Other (income), net | (22) | (19) | (33) | (24) | |||||||||||
Interest expense | 37 | 40 | 129 | 114 | |||||||||||
Interest (income) | — | (1) | (3) | (4) | |||||||||||
Income before income taxes | 182 | 164 | 272 | 262 | |||||||||||
Provision for income taxes | 51 | 62 | 112 | 60 | |||||||||||
Income from continuing operations | 131 | 102 | 160 | 202 | |||||||||||
Income (loss) from discontinued operations, net | (3) | 162 | (52) | 237 | |||||||||||
Income on disposal of discontinued operations, net | 20 | — | 452 | — | |||||||||||
Net income | 148 | 264 | 560 | 439 | |||||||||||
Net income attributable to noncontrolling interest | — | — | — | (1) | |||||||||||
Net income attributable to Wyndham Destinations shareholders | $ | 148 | $ | 264 | $ | 560 | $ | 438 | |||||||
Basic earnings per share | |||||||||||||||
Continuing operations | $ | 1.32 | $ | 1.00 | $ | 1.61 | $ | 1.94 | |||||||
Discontinued operations | 0.17 | 1.58 | 4.01 | 2.29 | |||||||||||
$ | 1.49 | $ | 2.58 | $ | 5.62 | $ | 4.23 | ||||||||
Diluted earnings per share | |||||||||||||||
Continuing operations | $ | 1.31 | $ | 0.99 | $ | 1.60 | $ | 1.93 | |||||||
Discontinued operations | 0.18 | 1.58 | 4.00 | 2.28 | |||||||||||
$ | 1.49 | $ | 2.57 | $ | 5.60 | $ | 4.21 | ||||||||
Weighted average shares outstanding | |||||||||||||||
Basic | 99.1 | 102.4 | 99.7 | 103.7 | |||||||||||
Diluted | 99.5 | 102.9 | 100.1 | 104.2 | |||||||||||
Cash dividends declared per share | $ | 0.41 | $ | 0.58 | $ | 1.48 | $ | 1.74 | |||||||
Table 2 | ||||||||||||||||||||||
Wyndham DestinationsSummary Data Sheet(in millions, except per share amounts, unless otherwise indicated) | ||||||||||||||||||||||
Three Month Ended September 30 | Nine Months Ended September 30 | |||||||||||||||||||||
2018 | 2017 | Change | 2018 | 2017 | Change | |||||||||||||||||
Consolidated Results | ||||||||||||||||||||||
Net income attributable to Wyndham Destinations shareholders | $ | 148 | $ | 264 | (44) | % | $ | 560 | $ | 438 | 28 | % | ||||||||||
Diluted earnings per share | $ | 1.49 | $ | 2.57 | (42) | % | $ | 5.60 | $ | 4.21 | 33 | % | ||||||||||
Income from continuing operations | $ | 131 | $ | 102 | 28 | % | $ | 160 | $ | 202 | (21) | % | ||||||||||
Diluted earnings per share from continuing operations | $ | 1.31 | $ | 0.99 | 32 | % | $ | 1.60 | $ | 1.93 | (17) | % | ||||||||||
Adjusted Earnings from Continuing Operations | ||||||||||||||||||||||
Adjusted EBITDA | $ | 269 | $ | 253 | 6 | % | $ | 702 | $ | 657 | 7 | % | ||||||||||
Adjusted net income | $ | 148 | $ | 102 | 45 | % | $ | 343 | $ | 264 | 30 | % | ||||||||||
Adjusted diluted earnings per share | $ | 1.48 | $ | 0.99 | 49 | % | $ | 3.42 | $ | 2.54 | 35 | % | ||||||||||
Further Adjusted Earnings Metrics (a) | ||||||||||||||||||||||
Further adjusted EBITDA | $ | 271 | $ | 257 | 5 | % | $ | 717 | $ | 679 | 6 | % | ||||||||||
Further adjusted net income | $ | 146 | $ | 132 | 11 | % | $ | 357 | $ | 331 | 8 | % | ||||||||||
Further adjusted diluted earnings per share | $ | 1.47 | $ | 1.28 | 15 | % | $ | 3.57 | $ | 3.18 | 12 | % | ||||||||||
Segment Results | ||||||||||||||||||||||
Net Revenues | ||||||||||||||||||||||
Vacation Ownership | $ | 820 | $ | 768 | 7 | % | $ | 2,251 | $ | 2,152 | 5 | % | ||||||||||
Exchange & Rentals | 243 | 248 | (2) | % | 727 | 725 | — | % | ||||||||||||||
Corporate and other | (1) | (1) | (2) | (1) | ||||||||||||||||||
Total | $ | 1,062 | $ | 1,015 | 5 | % | $ | 2,976 | $ | 2,876 | 3 | % | ||||||||||
Adjusted EBITDA | ||||||||||||||||||||||
Vacation Ownership | $ | 203 | $ | 194 | 5 | % | $ | 530 | $ | 506 | 5 | % | ||||||||||
Exchange & Rentals | 79 | 80 | (1) | % | 228 | 222 | 3 | % | ||||||||||||||
Segment Adjusted EBITDA | 282 | 274 | 758 | 728 | ||||||||||||||||||
Corporate and other | (13) | (21) | (56) | (71) | ||||||||||||||||||
Total Adjusted EBITDA | $ | 269 | $ | 253 | 6 | % | $ | 702 | $ | 657 | 7 | % | ||||||||||
Further Adjusted EBITDA | ||||||||||||||||||||||
Vacation Ownership | $ | 203 | $ | 186 | 9 | % | $ | 520 | $ | 487 | 7 | % | ||||||||||
Exchange & Rentals | 79 | 80 | (1) | % | 228 | 222 | 3 | % | ||||||||||||||
Further Adjusted EBITDA | 282 | 266 | 748 | 709 | ||||||||||||||||||
Corporate and other | (11) | (9) | (31) | (30) | ||||||||||||||||||
Total Further Adjusted EBITDA | $ | 271 | $ | 257 | 5 | % | $ | 717 | $ | 679 | 6 | % | ||||||||||
Further Adjusted EBITDA Margin | 25.5 | % | 25.3 | % | 24.1 | % | 23.6 | % | ||||||||||||||
Key Operating Statistics | ||||||||||||||||||||||
Vacation Ownership | ||||||||||||||||||||||
Gross VOI sales | $ | 640 | $ | 600 | 7 | % | $ | 1,707 | $ | 1,600 | 7 | % | ||||||||||
Tours (in thousands) | 259 | 247 | 5 | % | 690 | 658 | 5 | % | ||||||||||||||
VPG (in dollars) | $ | 2,350 | $ | 2,299 | 2 | % | $ | 2,358 | $ | 2,315 | 2 | % | ||||||||||
New owner sales mix | 40.9 | % | 37.6 | % | 38.8 | % | 35.5 | % | ||||||||||||||
Exchange & Rentals | ||||||||||||||||||||||
Average number of members (in thousands) | 3,857 | 3,792 | 2 | % | 3,851 | 3,800 | 1 | % | ||||||||||||||
Exchange revenue per member (in dollars) | $ | 163.84 | $ | 172.43 | (5) | % | $ | 177.19 | $ | 180.83 | (2) | % | ||||||||||
Note: Amounts may not add due to rounding. See Table 9 for definitions. For a full reconciliation of non-GAAP financial measures to the most directly comparable GAAP financial measures, refer to Table 5. | |
(a) | Includes incremental license fees paid to Wyndham Hotels & Resorts and other changes being effected in conjunction with the spin-off. Corporate and other costs reflect the Company's position as if it were a standalone company during all reported periods. |
Table 3 | |||||||||||||||||||||
Wyndham DestinationsOperating Statistics | |||||||||||||||||||||
The following operating statistics are the drivers of the Company's revenues and therefore provide an enhanced understanding of the Company's businesses: | |||||||||||||||||||||
Year | Q1 | Q2 | Q3 | Q4 | Full Year | ||||||||||||||||
Vacation Ownership (a) | |||||||||||||||||||||
Gross VOI Sales (in millions) (b) | 2018 | $ | 465 | $ | 602 | $ | 640 | N/A | N/A | ||||||||||||
2017 | $ | 438 | $ | 562 | $ | 600 | $ | 538 | $ | 2,138 | |||||||||||
2016 | $ | 427 | $ | 517 | $ | 563 | $ | 501 | $ | 2,007 | |||||||||||
Tours (in thousands) | 2018 | 190 | 241 | 259 | N/A | N/A | |||||||||||||||
2017 | 176 | 235 | 247 | 210 | 869 | ||||||||||||||||
2016 | 179 | 213 | 230 | 197 | 819 | ||||||||||||||||
VPG | 2018 | $ | 2,303 | $ | 2,411 | $ | 2,350 | N/A | N/A | ||||||||||||
2017 | $ | 2,354 | $ | 2,302 | $ | 2,299 | $ | 2,438 | $ | 2,345 | |||||||||||
2016 | $ | 2,244 | $ | 2,328 | $ | 2,320 | $ | 2,399 | $ | 2,324 | |||||||||||
Provision for Loan Losses (in millions) (c) | 2018 | $ | (92) | $ | (126) | $ | (132) | N/A | N/A | ||||||||||||
2017 | $ | (85) | $ | (110) | $ | (123) | $ | (101) | $ | (420) | |||||||||||
2016 | $ | (63) | $ | (90) | $ | (104) | $ | (86) | $ | (342) | |||||||||||
Provision for Loan Loss as a Percentage of Gross VOI Sales, net of fee-for-service sales | 2018 | 20.4 | % | 21.4 | % | 20.8 | % | N/A | N/A | ||||||||||||
2017 | 19.6 | % | 19.8 | % | 20.9 | % | 19.3 | % | 20.0 | % | |||||||||||
2016 | 15.6 | % | 18.0 | % | 19.0 | % | 17.2 | % | 17.6 | % | |||||||||||
Allowance for Loan Losses (in millions) | 2018 | $ | 684 | $ | 705 | $ | 743 | N/A | N/A | ||||||||||||
2017 | $ | 619 | $ | 643 | $ | 684 | $ | 691 | $ | 691 | |||||||||||
2016 | $ | 570 | $ | 585 | $ | 619 | $ | 621 | $ | 621 | |||||||||||
Gross Vacation Ownership Contract Receivables (in millions) | 2018 | $ | 3,560 | $ | 3,609 | $ | 3,732 | N/A | N/A | ||||||||||||
2017 | $ | 3,377 | $ | 3,435 | $ | 3,547 | $ | 3,591 | $ | 3,591 | |||||||||||
2016 | $ | 3,270 | $ | 3,297 | $ | 3,379 | $ | 3,398 | $ | 3,398 | |||||||||||
Allowance for Loan Loss as a Percentage of Gross Vacation Ownership Contract Receivables | 2018 | 19.2 | % | 19.5 | % | 19.9 | % | N/A | N/A | ||||||||||||
2017 | 18.3 | % | 18.7 | % | 19.3 | % | 19.2 | % | 19.2 | % | |||||||||||
2016 | 17.4 | % | 17.7 | % | 18.3 | % | 18.3 | % | 18.3 | % | |||||||||||
Exchange & Rentals (a) | |||||||||||||||||||||
Average Number of Members (in thousands) | 2018 | 3,852 | 3,844 | 3,857 | N/A | N/A | |||||||||||||||
2017 | 3,817 | 3,791 | 3,792 | 3,796 | 3,799 | ||||||||||||||||
2016 | 3,841 | 3,857 | 3,868 | 3,843 | 3,852 | ||||||||||||||||
Exchange Revenue Per Member | 2018 | $ | 194.70 | $ | 173.05 | $ | 163.84 | N/A | N/A | ||||||||||||
2017 | $ | 195.84 | $ | 174.12 | $ | 172.43 | $ | 164.45 | $ | 176.74 | |||||||||||
2016 | $ | 193.06 | $ | 170.48 | $ | 169.18 | $ | 157.56 | $ | 172.56 | |||||||||||
Note: | Full year amounts and percentages may not compute due to rounding. |
(a) | Includes the impact of acquisitions from the acquisition dates forward. |
(b) | Includes Gross VOI sales under the Company's fee-for-service sales. (See Table 6 for a reconciliation of Gross VOI sales to Net VOI sales). |
(c) | Represents provision for estimated losses on vacation ownership contract receivables originated during the period, which is recorded as a contra revenue to vacation ownership interest sales on the Consolidated Statements of Income. |
Table 4 | ||||||||||||||||||||
Wyndham DestinationsRevenue by Reportable Segment(in millions) | ||||||||||||||||||||
2018 | ||||||||||||||||||||
Q1 | Q2 | Q3 | Q4 | Full Year | ||||||||||||||||
Vacation Ownership | ||||||||||||||||||||
Net VOI Sales | $ | 358 | $ | 462 | $ | 503 | N/A | N/A | ||||||||||||
Consumer Financing | 118 | 120 | 126 | N/A | N/A | |||||||||||||||
Property Management Fees and Reimbursable Revenues | 164 | 162 | 172 | N/A | N/A | |||||||||||||||
Other Revenues | 21 | 26 | 19 | N/A | N/A | |||||||||||||||
Total Vacation Ownership | 661 | 770 | 820 | N/A | N/A | |||||||||||||||
Exchange & Rentals | ||||||||||||||||||||
Exchange Revenues | 188 | 166 | 158 | N/A | N/A | |||||||||||||||
Rental & Other Revenues | 58 | 72 | 85 | N/A | N/A | |||||||||||||||
Total Exchange & Rentals | 246 | 238 | 243 | N/A | N/A | |||||||||||||||
Total Reportable Segments | $ | 907 | $ | 1,008 | $ | 1,063 | N/A | N/A | ||||||||||||
2017 | ||||||||||||||||||||
Q1 | Q2 | Q3 | Q4 | Full Year | ||||||||||||||||
Vacation Ownership | ||||||||||||||||||||
Net VOI Sales | $ | 350 | $ | 446 | $ | 466 | $ | 422 | $ | 1,684 | ||||||||||
Consumer Financing | 111 | 114 | 119 | 120 | 463 | |||||||||||||||
Property Management Fees and Reimbursable Revenues | 163 | 164 | 160 | 162 | 649 | |||||||||||||||
Other Revenues | 15 | 21 | 23 | 25 | 85 | |||||||||||||||
Total Vacation Ownership | 639 | 745 | 768 | 729 | 2,881 | |||||||||||||||
Exchange & Rentals | ||||||||||||||||||||
Exchange Revenues | 187 | 165 | 163 | 156 | 671 | |||||||||||||||
Rental & Other Revenues | 56 | 69 | 85 | 46 | 256 | |||||||||||||||
Total Exchange & Rentals | 243 | 234 | 248 | 202 | 927 | |||||||||||||||
Total Reportable Segments | $ | 882 | $ | 978 | $ | 1,016 | $ | 931 | $ | 3,805 | ||||||||||
2016 | ||||||||||||||||||||
Q1 | Q2 | Q3 | Q4 | Full Year | ||||||||||||||||
Vacation Ownership | ||||||||||||||||||||
Net VOI Sales | $ | 341 | $ | 407 | $ | 439 | $ | 414 | $ | 1,601 | ||||||||||
Consumer Financing | 107 | 108 | 112 | 113 | 440 | |||||||||||||||
Property Management Fees and Reimbursable Revenues | 153 | 151 | 160 | 159 | 623 | |||||||||||||||
Other Revenues | 33 | 34 | 29 | 14 | 110 | |||||||||||||||
Total Vacation Ownership | 634 | 700 | 740 | 700 | 2,774 | |||||||||||||||
Exchange & Rentals | ||||||||||||||||||||
Exchange Revenues | 185 | 164 | 164 | 151 | 665 | |||||||||||||||
Rental & Other Revenues | 58 | 67 | 83 | 45 | 251 | |||||||||||||||
Total Exchange & Rentals | 243 | 231 | 247 | 196 | 916 | |||||||||||||||
Total Reportable Segments | $ | 877 | $ | 931 | $ | 987 | $ | 896 | $ | 3,690 | ||||||||||
Note: | Full year amounts may not add across due to rounding. |
Table 5 | |||||||||||||||||||||||||||||||
Wyndham DestinationsNon-GAAP Measure: Reconciliation of Net Income to Adjusted EBITDA to Further Adjusted EBITDAto Further Adjusted Net Income From Continuing Operations(in millions, except diluted per share amounts) | |||||||||||||||||||||||||||||||
Three Month Ended September 30 | Nine Months Ended September 30 | ||||||||||||||||||||||||||||||
2018 | EPS | 2017 | EPS | 2018 | EPS | 2017 | EPS | ||||||||||||||||||||||||
Net Income attributable to Wyndham Destinations shareholders | $ | 148 | $ | 1.49 | $ | 264 | $ | 2.57 | $ | 560 | $ | 5.60 | $ | 438 | $ | 4.21 | |||||||||||||||
Income on disposal of discontinued operations, net of income taxes | 20 | — | 452 | — | |||||||||||||||||||||||||||
Income (loss) from discontinued operations, net of income taxes | (3) | 162 | (52) | 237 | |||||||||||||||||||||||||||
Net income attributable to noncontrolling interest | — | — | — | (1) | |||||||||||||||||||||||||||
Income from continuing operations | $ | 131 | $ | 1.31 | $ | 102 | $ | 0.99 | $ | 160 | $ | 1.60 | $ | 202 | $ | 1.93 | |||||||||||||||
Restructuring costs | — | 8 | — | 14 | |||||||||||||||||||||||||||
Separation-related | 35 | 16 | 198 | 16 | |||||||||||||||||||||||||||
Legacy items | — | (7) | — | (6) | |||||||||||||||||||||||||||
Amortization of acquired intangibles (a) | 3 | 3 | 9 | 8 | |||||||||||||||||||||||||||
Debt modification costs in interest expense (b) | — | — | 2 | — | |||||||||||||||||||||||||||
Impairments | (4) | — | (4) | 140 | |||||||||||||||||||||||||||
Acquisition-related deal costs | — | (13) | — | (13) | |||||||||||||||||||||||||||
Value-added tax refund | (16) | — | (16) | — | |||||||||||||||||||||||||||
Tax effect of adjustments (c) | (1) | (8) | (7) | (97) | |||||||||||||||||||||||||||
Adjusted net income from continuing operations | $ | 148 | $ | 1.48 | $ | 102 | $ | 0.99 | $ | 343 | $ | 3.42 | $ | 264 | $ | 2.54 | |||||||||||||||
Income taxes on adjusted net income | 52 | 70 | 119 | 157 | |||||||||||||||||||||||||||
Stock-based compensation expense (d) | 3 | 11 | 21 | 34 | |||||||||||||||||||||||||||
Depreciation (a) | 29 | 32 | 96 | 92 | |||||||||||||||||||||||||||
Interest expense (b) | 37 | 40 | 127 | 114 | |||||||||||||||||||||||||||
Interest income | — | (1) | (3) | (4) | |||||||||||||||||||||||||||
Adjusted EBITDA | $ | 269 | $ | 253 | $ | 702 | $ | 657 | |||||||||||||||||||||||
Separation adjustments (e) | — | (8) | (10) | (19) | |||||||||||||||||||||||||||
Corporate and other costs (f) | 1 | 12 | 26 | 41 | |||||||||||||||||||||||||||
Further adjusted EBITDA | $ | 271 | $ | 257 | $ | 717 | $ | 679 | |||||||||||||||||||||||
Depreciation (a) (g) | (29) | (29) | (91) | (81) | |||||||||||||||||||||||||||
Interest expense (h) | (40) | (40) | (120) | (120) | |||||||||||||||||||||||||||
Stock-based compensation (d) | (3) | (8) | (15) | (25) | |||||||||||||||||||||||||||
Further adjusted taxes (i) | (52) | (49) | (133) | (122) | |||||||||||||||||||||||||||
Further adjusted net income from continuing operations | $ | 146 | $ | 1.47 | $ | 132 | $ | 1.28 | $ | 357 | $ | 3.57 | $ | 331 | $ | 3.18 | |||||||||||||||
Diluted Shares Outstanding | 99.5 | 102.9 | 100.1 | 104.2 | |||||||||||||||||||||||||||
Amounts may not add due to rounding. The table above reconciles certain non-GAAP financial measures to their closest GAAP measure. The presentation of these adjustments is intended to permit the comparison of particular adjustments as they appear in the income statement in order to assist investors' understanding of the overall impact of such adjustments. In addition to GAAP financial measures, the Company provides adjusted net income from continuing operations and adjusted diluted EPS from continuing operations to assist our investors in evaluating our ongoing operating performance for the current reporting period and, where provided, over different reporting periods, by adjusting for certain items which in our view do not necessarily reflect ongoing performance. We also internally use these measures to assess our operating performance, both absolutely and in comparison to other companies, and in evaluating or making selected compensation decisions. The Company is also presenting non-GAAP results on a further adjusted basis as if the spin-off of its hotel business and the sale of its European vacation rentals business had occurred for all periods presented. These supplemental disclosures are in addition to GAAP reported measures. Non-GAAP measures should not be considered a substitute for, nor superior to, financial results and measures determined or calculated in accordance with GAAP.
(a) | Amortization of acquisition-related assets is excluded from adjusted net income from continuing operations, adjusted EBITDA, further adjusted EBITDA and further adjusted net income from continuing operations. |
(b) | Debt modification costs in interest expense are excluded from adjusted net income from continuing operations, adjusted EBITDA, further adjusted EBITDA and further adjusted net income from continuing operations. |
(c) | In the nine months ended September 30, 2018, amounts represent the tax effect of the adjustments partially offset by $30 million of non-cash state tax expense related to the separation of the hotel business and $13 million of non-cash tax expense from certain internal restructurings associated with the sale of its European vacation rentals business. |
(d) | Stock-based compensation is excluded from further adjusted EBITDA but included as a reduction to further adjusted net income from continuing operations. |
(e) | Includes incremental license fees paid to Wyndham Hotels & Resorts and other changes being effected in conjunction with the spin-off. |
(f) | Corporate and other costs reflect the Company's position as if the spin-off of its hotel business and the sale of its European vacation rentals business had occurred for all reported periods. |
(g) | Includes expected depreciation related to retained Wyndham Destinations' corporate assets. |
(h) | Interest expense was calculated based on $3.0 billion of outstanding debt, excluding non-recourse vacation ownership debt, and a non-investment-grade rating, resulting in higher interest rates for select tranches of notes. |
(i) | For comparative purposes this assumes a stabilized effective tax rate of 27% in all quarters prior to the spin-off, which occurred in the second quarter of 2018. The rate used for 2017 reflects the benefit of the tax rate reduction resulting from the U.S. Tax Cuts and Jobs Act. |
Table 6 | |||||||||||||||||||||
Wyndham DestinationsNon-GAAP Measure: Reconciliation of Gross VOI Sales(in millions) | |||||||||||||||||||||
The Company believes gross VOI sales provide an enhanced understanding of the performance of its vacation ownership business because it directly measures the sales volume of this business during a given reporting period. | |||||||||||||||||||||
The following table provides a reconciliation of Gross VOI sales (see Table 3) to Net VOI sales (see Table 4): | |||||||||||||||||||||
Year | |||||||||||||||||||||
2018 | Q1 | Q2 | Q3 | Q4 | Full Year | ||||||||||||||||
Gross VOI sales | $ | 465 | $ | 602 | $ | 640 | N/A | N/A | |||||||||||||
Less: Sales under fee-for-service | (15) | (14) | (5) | N/A | N/A | ||||||||||||||||
Gross VOI sales, net of fee-for-service sales | 450 | 588 | 635 | N/A | N/A | ||||||||||||||||
Less: Loan loss provision | (92) | (126) | (132) | N/A | N/A | ||||||||||||||||
Net VOI sales | $ | 358 | $ | 462 | $ | 503 | N/A | N/A | |||||||||||||
2017 | |||||||||||||||||||||
Gross VOI sales | $ | 438 | $ | 562 | $ | 600 | $ | 538 | $ | 2,138 | |||||||||||
Less: Sales under fee-for-service | (3) | (5) | (11) | (15) | (35) | ||||||||||||||||
Gross VOI sales, net of fee-for-service sales | 435 | 556 | 589 | 523 | 2,104 | ||||||||||||||||
Less: Loan loss provision | (85) | (110) | (123) | (101) | (420) | ||||||||||||||||
Net VOI sales | $ | 350 | $ | 446 | $ | 466 | $ | 422 | $ | 1,684 | |||||||||||
2016 | |||||||||||||||||||||
Gross VOI sales | $ | 427 | $ | 517 | $ | 563 | $ | 501 | $ | 2,007 | |||||||||||
Less: Sales under fee-for-service | (23) | (20) | (20) | (1) | (64) | ||||||||||||||||
Gross VOI sales, net of fee-for-service sales | 404 | 497 | 543 | 500 | 1,944 | ||||||||||||||||
Less: Loan loss provision | (63) | (90) | (104) | (86) | (342) | ||||||||||||||||
Net VOI sales | $ | 341 | $ | 407 | $ | 439 | $ | 414 | $ | 1,601 | |||||||||||
The following includes primarily tele-sales upgrades and other non-tour revenues, which are excluded from Gross VOI sales in the Company's VPG calculation (see Table 3):
Non-tour revenues | Q1 | Q2 | Q3 | Q4 | Full Year | |||||||||||||||
2018 | $ | 28 | $ | 21 | $ | 31 | N/A | N/A | ||||||||||||
2017 | $ | 24 | $ | 20 | $ | 32 | $ | 26 | $ | 102 | ||||||||||
2016 | $ | 24 | $ | 23 | $ | 30 | $ | 29 | $ | 105 | ||||||||||
Note: Amounts may not add due to rounding. |
Table 7 | ||||||||
Wyndham DestinationsNon-GAAP Measure: Reconciliation of Free Cash Flows and Further Adjusted Free Cash Flows(in millions) | ||||||||
Nine Months Ended September 30 | ||||||||
2018 | 2017 | |||||||
Continuing Operations | ||||||||
Net cash provided by operating activities | $ | 205 | $ | 264 | ||||
Less: Property and equipment additions | (63) | (76) | ||||||
Less: Sum of proceeds and principal payments of non-recourse vacation ownership debt | 94 | (146) | ||||||
Free cash flow from continuing operations | $ | 236 | $ | 42 | ||||
Corporate and other costs (a) | 27 | 145 | ||||||
Separation adjustments | 93 | — | ||||||
Further adjusted free cash flow from continuing operations | $ | 356 | $ | 187 | ||||
Discontinued Operations | ||||||||
Net cash provided by operating activities | $ | 150 | $ | 400 | ||||
Less: Property and equipment additions | — | — | ||||||
Less: Sum of proceeds and principal payments of non-recourse vacation ownership debt | — | — | ||||||
Free cash flow from discontinued operations | $ | 150 | $ | 400 | ||||
Corporate and other costs (a) | — | — | ||||||
Separation adjustments | — | — | ||||||
Further adjusted free cash flow from discontinued operations | $ | 150 | $ | 400 | ||||
Total further adjusted free cash flow | $ | 506 | $ | 587 | ||||
(a) | Includes incremental license fees paid to Wyndham Hotels & Resorts and other changes being effected in conjunction with the spin-off including corporate costs that reflect the Company's position as if the spin-off had occurred for all periods presented. |
Table 8 | ||||||||||||
Wyndham Destinations2018 Further Adjusted Guidance(in millions, except per share amounts) | ||||||||||||
2018 | 2017 | |||||||||||
Q1 | Q2 | Q3 | Q4 | Full Year | Full Year | |||||||
Net revenues | $907 | $1,007 | $1,062 | N/A | $3,925 - $3,975 | $3,806 | ||||||
Adjusted EBITDA | $189 | $243 | $269 | $229 - $236 | $931 - $938 | $882 | ||||||
Separation adjustments (a) | (5) | (5) | — | — | (10) | (25) | ||||||
Corporate and other costs (b) | 13 | 11 | 1 | 6 - 8 | 31 - 33 | 57 | ||||||
Further adjusted EBITDA | $197 | $249 | $271 | $235 - $243 | $952 - $960 | $914 | ||||||
Depreciation and amortization (c) | (31) | (31) | (29) | ($27 - $31) | ($119 - $123) | (110) | ||||||
Interest expense (d) | (40) | (40) | (40) | ($38 - $42) | ($158 - $162) | (160) | ||||||
Stock-based compensation | (9) | (4) | (3) | ($2 - $4) | ($17 - $19) | (35) | ||||||
Further adjusted pre-tax income | $117 | $174 | $198 | $162 - $170 | $652 - $660 | $609 | ||||||
Further adjusted taxes (e) | (32) | (49) | (52) | ($43 - $46) | ($176 - $179) | (164) | ||||||
Further adjusted net income from continuing operations | $85 | $125 | $146 | $118 - $126 | $475 - $483 | $443 | ||||||
Weighted average diluted shares outstanding | 101.6 | 100.3 | 99.5 | 98.1 | 99.7 | 103.7 | ||||||
Further adjusted diluted earnings per share | $0.84 | $1.25 | $1.47 | $1.20 - $1.28 | $4.77 - $4.85 | $4.29 | ||||||
Note: Amounts may not add due to rounding. The Company is providing guidance for net income, EBITDA and diluted EPS only on a non-GAAP further adjusted basis because not all of the information necessary for a quantitative reconciliation of forward-looking non-GAAP financial measures to the most directly comparable GAAP financial measures is available without unreasonable effort, primarily due to uncertainties relating to the occurrence or amount of these adjustments or other potential adjustments that may arise in the future. Unavailable reconciling items could significantly impact the Company's financial results. Definitions are included in Table 9. | |
(a) | Includes incremental license fees paid to Wyndham Hotels & Resorts and other changes being effected in conjunction with the spin-off. |
(b) | Represents the difference between corporate costs incurred and those expected to be incurred following the spin-off and transition period. |
(c) | Excludes amortization of acquisition-related intangible assets. Includes expected depreciation related to retained Wyndham Destinations' corporate assets. |
(d) | Interest expense was calculated based on $3.0 billion of outstanding debt, excluding non-recourse vacation ownership debt, and a non-investment-grade rating, resulting in higher interest rates for select tranches of notes. |
(e) | Assumes a stabilized effective tax rate of approximately 27% in all quarters, prior to the spin-off, which occurred in the second quarter of 2018. The rate used for 2017 reflects the benefit of the tax rate reduction resulting from the U.S. Tax Cuts and Jobs Act. |
2018 Guidance | |||||||||
Further Adjusted EBITDA Guidance Bridge | 3Q | 4Q | Full Year | ||||||
Prior Further Adjusted EBITDA Guidance (midpoint) | $268 | $250 | $965 | ||||||
Hurricane impacts | (10) | (6) | (16) | ||||||
Timing | 5 | (5) | — | ||||||
Operational over-performance | 7 | — | 7 | ||||||
Revised Further Adjusted EBITDA Guidance (midpoint) | $271 | $239 | $956 | ||||||
Note: Amounts may not add due to rounding. | |||||||||
2018 Guidance | Adjusted EBITDA Impact of | ||||||
Full-Year Drivers | 2017 | Low | High | 100 bps Change (a) | |||
Vacation Ownership | |||||||
Tours | 6% | 5% | 7% | $6.0 | |||
VPG | 1% | 1% | 3% | $9.0 | |||
Exchange & Rentals | |||||||
Average number of members | (1%) | 1% | 3% | $4.5 | |||
Exchange revenue per member | 2% | (2%) | 0% | $7.0 | |||
(a) Sensitivities for revenue drivers are based on average systemwide trends. Operating circumstances including but not limited to brand mix, product mix, geographical concentration or market segment result in variability, which may change the impact. | |||||||
Table 9
Definitions
Adjusted EBITDA: A non-GAAP measure, defined by the Company as net income before depreciation and amortization, interest expense (excluding consumer financing interest), early extinguishment of debt, interest income (excluding consumer financing revenues) and income taxes, each of which is presented on the Condensed Consolidated Statements of Income. Adjusted EBITDA also excludes stock-based compensation costs, separation and restructuring costs, transaction costs and impairments, and items that meet the conditions of unusual and/or infrequent. We believe that Adjusted EBITDA is useful to assist our investors in evaluating our ongoing operating performance for the current reporting period and, where provided, over different reporting periods. We also internally use these measures to assess our operating performance, both absolutely and in comparison to other companies, and in evaluating or making selected compensation decisions. Adjusted EBITDA should not be considered in isolation or as a substitute for net income or other income statement data prepared in accordance with GAAP and our presentation of Adjusted EBITDA may not be comparable to similarly-titled measures used by other companies.
Further adjusted earnings measures: A non-GAAP measure, defined by the Company to exclude certain items including impairment charges, restructuring and other related charges, transaction-related items, contract termination costs and other significant charges which in the Company's view does not reflect ongoing performance. Further adjusted earnings measures adjust for license fees, credit card income and corporate expense to reflect the performance of the Company as if it were separated from Wyndham Hotels & Resorts during all reported periods. All further adjusted earnings measures are reported from continuing operations, unless otherwise noted. Wyndham Destinations believes that these measures are useful to investors as supplemental measures in evaluating the aggregate performance of the Company. A full reconciliation of non-GAAP measures to GAAP are included in Table 5.
Gross Vacation Ownership Interest Sales: Represents sales of vacation ownership interests (VOIs), including sales under the fee-for-service program before the effect of loan loss provisions. We believe that Gross VOI sales provide an enhanced understanding of the performance of our vacation ownership business because it directly measures the sales volume of this business during a given reporting period.
Tours: Represents the number of tours taken by guests in our efforts to sell VOIs.
Volume Per Guest (VPG): Represents Gross VOI sales (excluding tele-sales upgrades, which are non-tour upgrade sales) divided by the number of tours. The Company has excluded non-tour upgrade sales in the calculation of VPG because non-tour upgrade sales are generated by a different marketing channel.
Average Number of Members: Represents members in our vacation exchange programs who paid annual membership dues as of the end of the period or who are within the allowed grace period. For additional fees, such participants are entitled to exchange intervals for intervals at other properties affiliated with the Company's vacation exchange business. In addition, certain participants may exchange intervals for other leisure-related services and products.
Exchange Revenue Per Member: Represents total annualized revenues generated from fees associated with memberships, exchange transactions, member-related rentals and other servicing for the period divided by the average number of vacation exchange members during the period.
Free Cash Flow (FCF): A non-GAAP measure, defined by the Company as Net Cash provided by operating activities less property and equipment additions which the Company also refers to as capital expenditures and less the sum of proceeds and principal payments of non-recourse vacation ownership debt. The Company believes free cash flow to be a useful operating performance measure to evaluate the ability of its operations to generate cash for uses other than capital expenditures and, after debt service and other obligations, its ability to grow its business through acquisitions, development advances and equity investments, as well as its ability to return cash to shareholders through dividends and share repurchases. A limitation of using free cash flow versus the GAAP measures of net cash provided by operating activities as a means for evaluating Wyndham Destinations is that free cash flow does not represent the total cash movement for the period as detailed in the consolidated statement of cash flows.
Net Debt: Net debt equals total debt outstanding, less non-recourse vacation ownership debt and cash and cash equivalents.
Leverage Ratio: The Company calculates leverage ratio as net debt divided by Adjusted EBITDA.
![]()
![]() View original content to download multimedia:http://www.prnewswire.com/news-releases/wyndham-destinations-reports-third-quarter-2018-results-300741958.html
View original content to download multimedia:http://www.prnewswire.com/news-releases/wyndham-destinations-reports-third-quarter-2018-results-300741958.html
SOURCE Wyndham Destinations
Serious News for Serious Traders! Try StreetInsider.com Premium Free!
You May Also Be Interested In
- Pembina joins proposed 1M bbl/day Alberta-to-coast pipeline plan
- Haverty Furniture expands credit facility to $100M, extends to 2031
- Six Flags names Mark Pauls as chief operating officer
Create E-mail Alert Related Categories
Press ReleasesRelated Entities
Dividend, Stock Buyback, Earnings, Definitive AgreementSign up for StreetInsider Free!
Receive full access to all new and archived articles, unlimited portfolio tracking, e-mail alerts, custom newswires and RSS feeds - and more!